The highest-paying states for nurses in 2025, and where your paycheck goes furthest
By Diana Perez · Facebook LinkedIn Email
The new nurse wage numbers are out, and there is one line worth reading twice. The typical registered nurse got a bigger raise last year than the average nurse did.
That sounds like nonsense until you look at the two figures side by side. The average RN wage rose 4.2%, to $98,430. The median, meaning the nurse standing exactly in the middle of the profession, rose 8.8%, to $93,600. When the middle climbs twice as fast as the average, the gains landed in the middle of the pay scale rather than at the top. If you have felt like your paycheck moved more than the headlines suggested, the data is on your side.
Everything below comes from the U.S. Bureau of Labor Statistics wage survey for May 2024, released this April. It counts 3,282,010 registered nurses. For context, the average American worker in any occupation earned $67,920, so nursing pays about 45% above the national average for all work.
Now for the part everyone actually scrolls for: where.
California is not competing in the same league
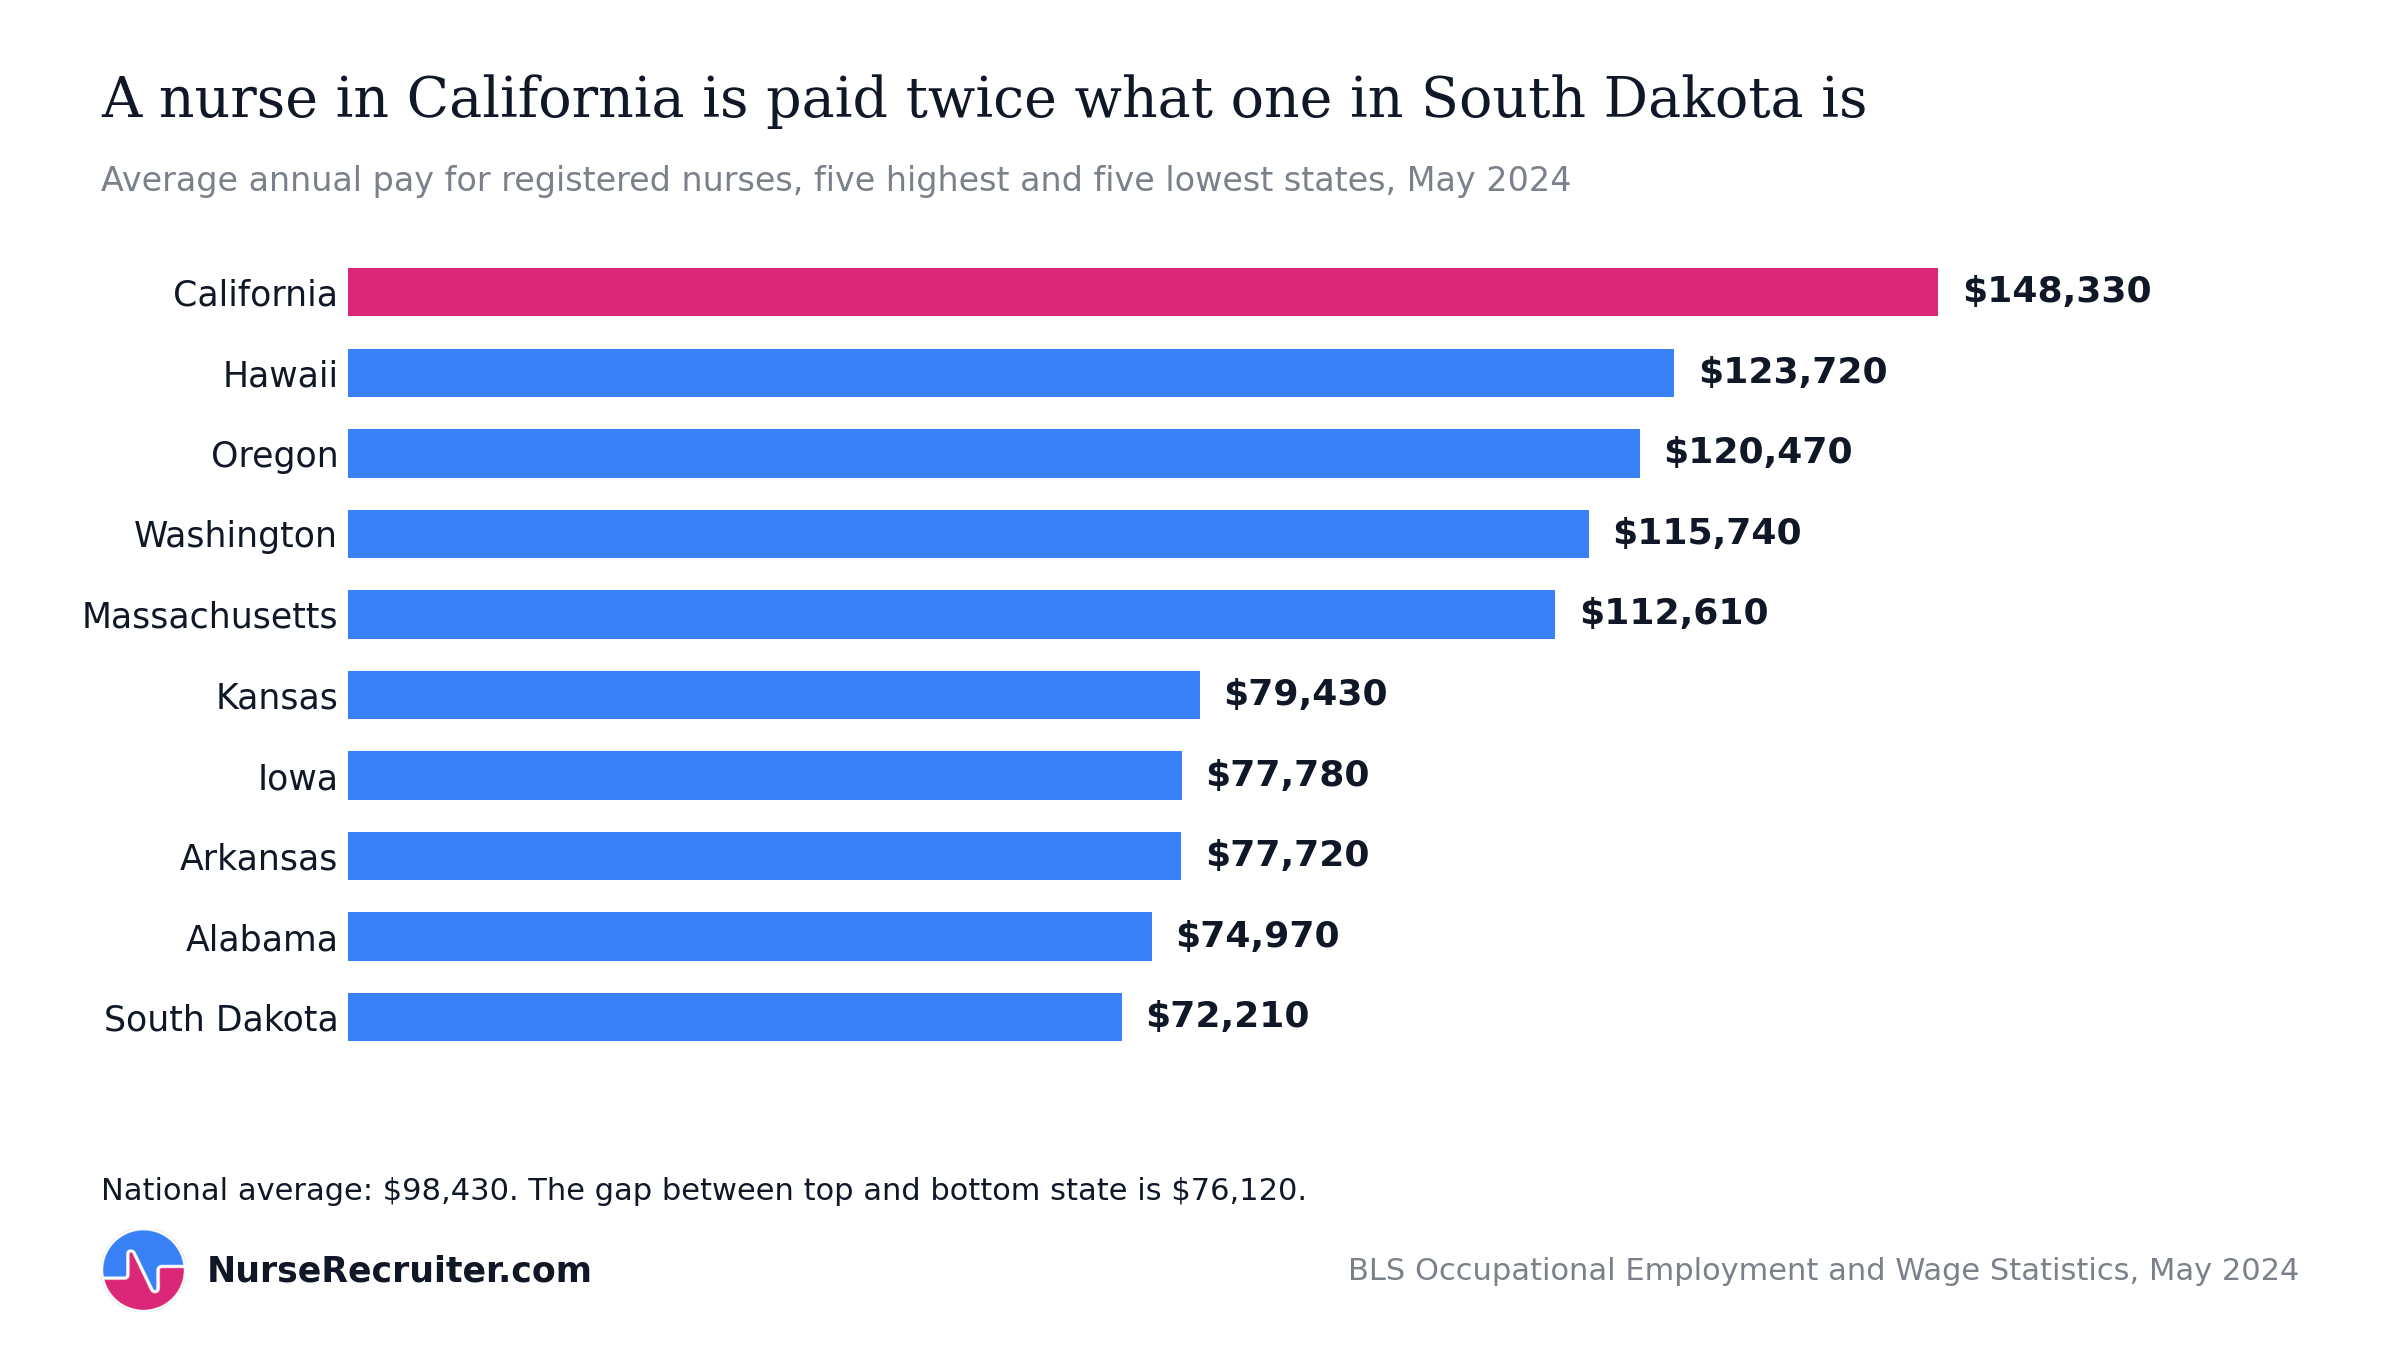
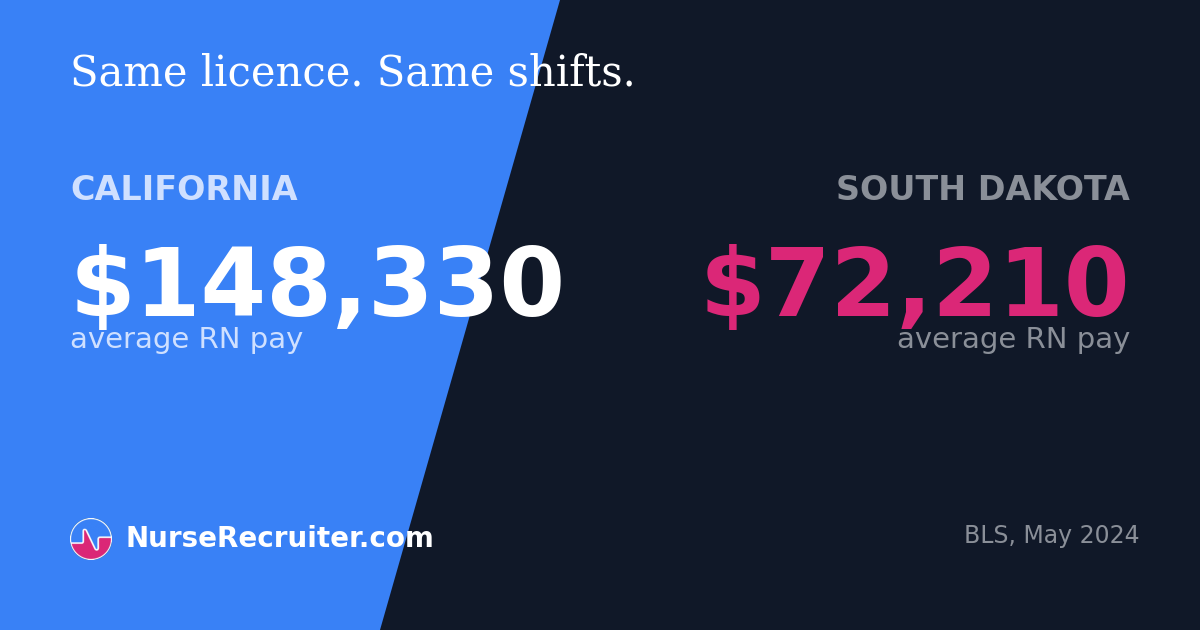
California pays registered nurses an average of $148,330. South Dakota pays $72,210. That is a gap of $76,120. One state pays more than double the other for the same license, the same shifts, and the same patients.
The rest of the top five is a straight run up the Pacific coast plus one outlier: Hawaii at $123,720, Oregon at $120,470, Washington at $115,740, and Massachusetts at $112,610. Just behind them come Alaska ($112,040), New York ($110,490), the District of Columbia ($109,240), New Jersey ($106,990) and Connecticut ($103,670).
At the other end sit South Dakota, Alabama ($74,970), Arkansas ($77,720), Iowa ($77,780) and Kansas ($79,430).
There is a wrinkle here that says something about how this market really works. South Dakota pays the least of any state, and it has more nurses per thousand workers than anywhere else in the country, 32 per 1,000 jobs. West Virginia is second at 31. Nursing being a big share of the local job market does not push wages up. If anything, the places most dependent on nurses pay them least.
Then there is the small matter of what things cost
Every time we publish these numbers, someone points out, correctly, that a California salary buys California groceries. So we checked. The federal government publishes something called Regional Price Parities, a measure of what a dollar actually buys in each state, covering rent, food, transport, medical care and the rest. Divide the wage by the price level and you get buying power rather than a number on a pay stub.
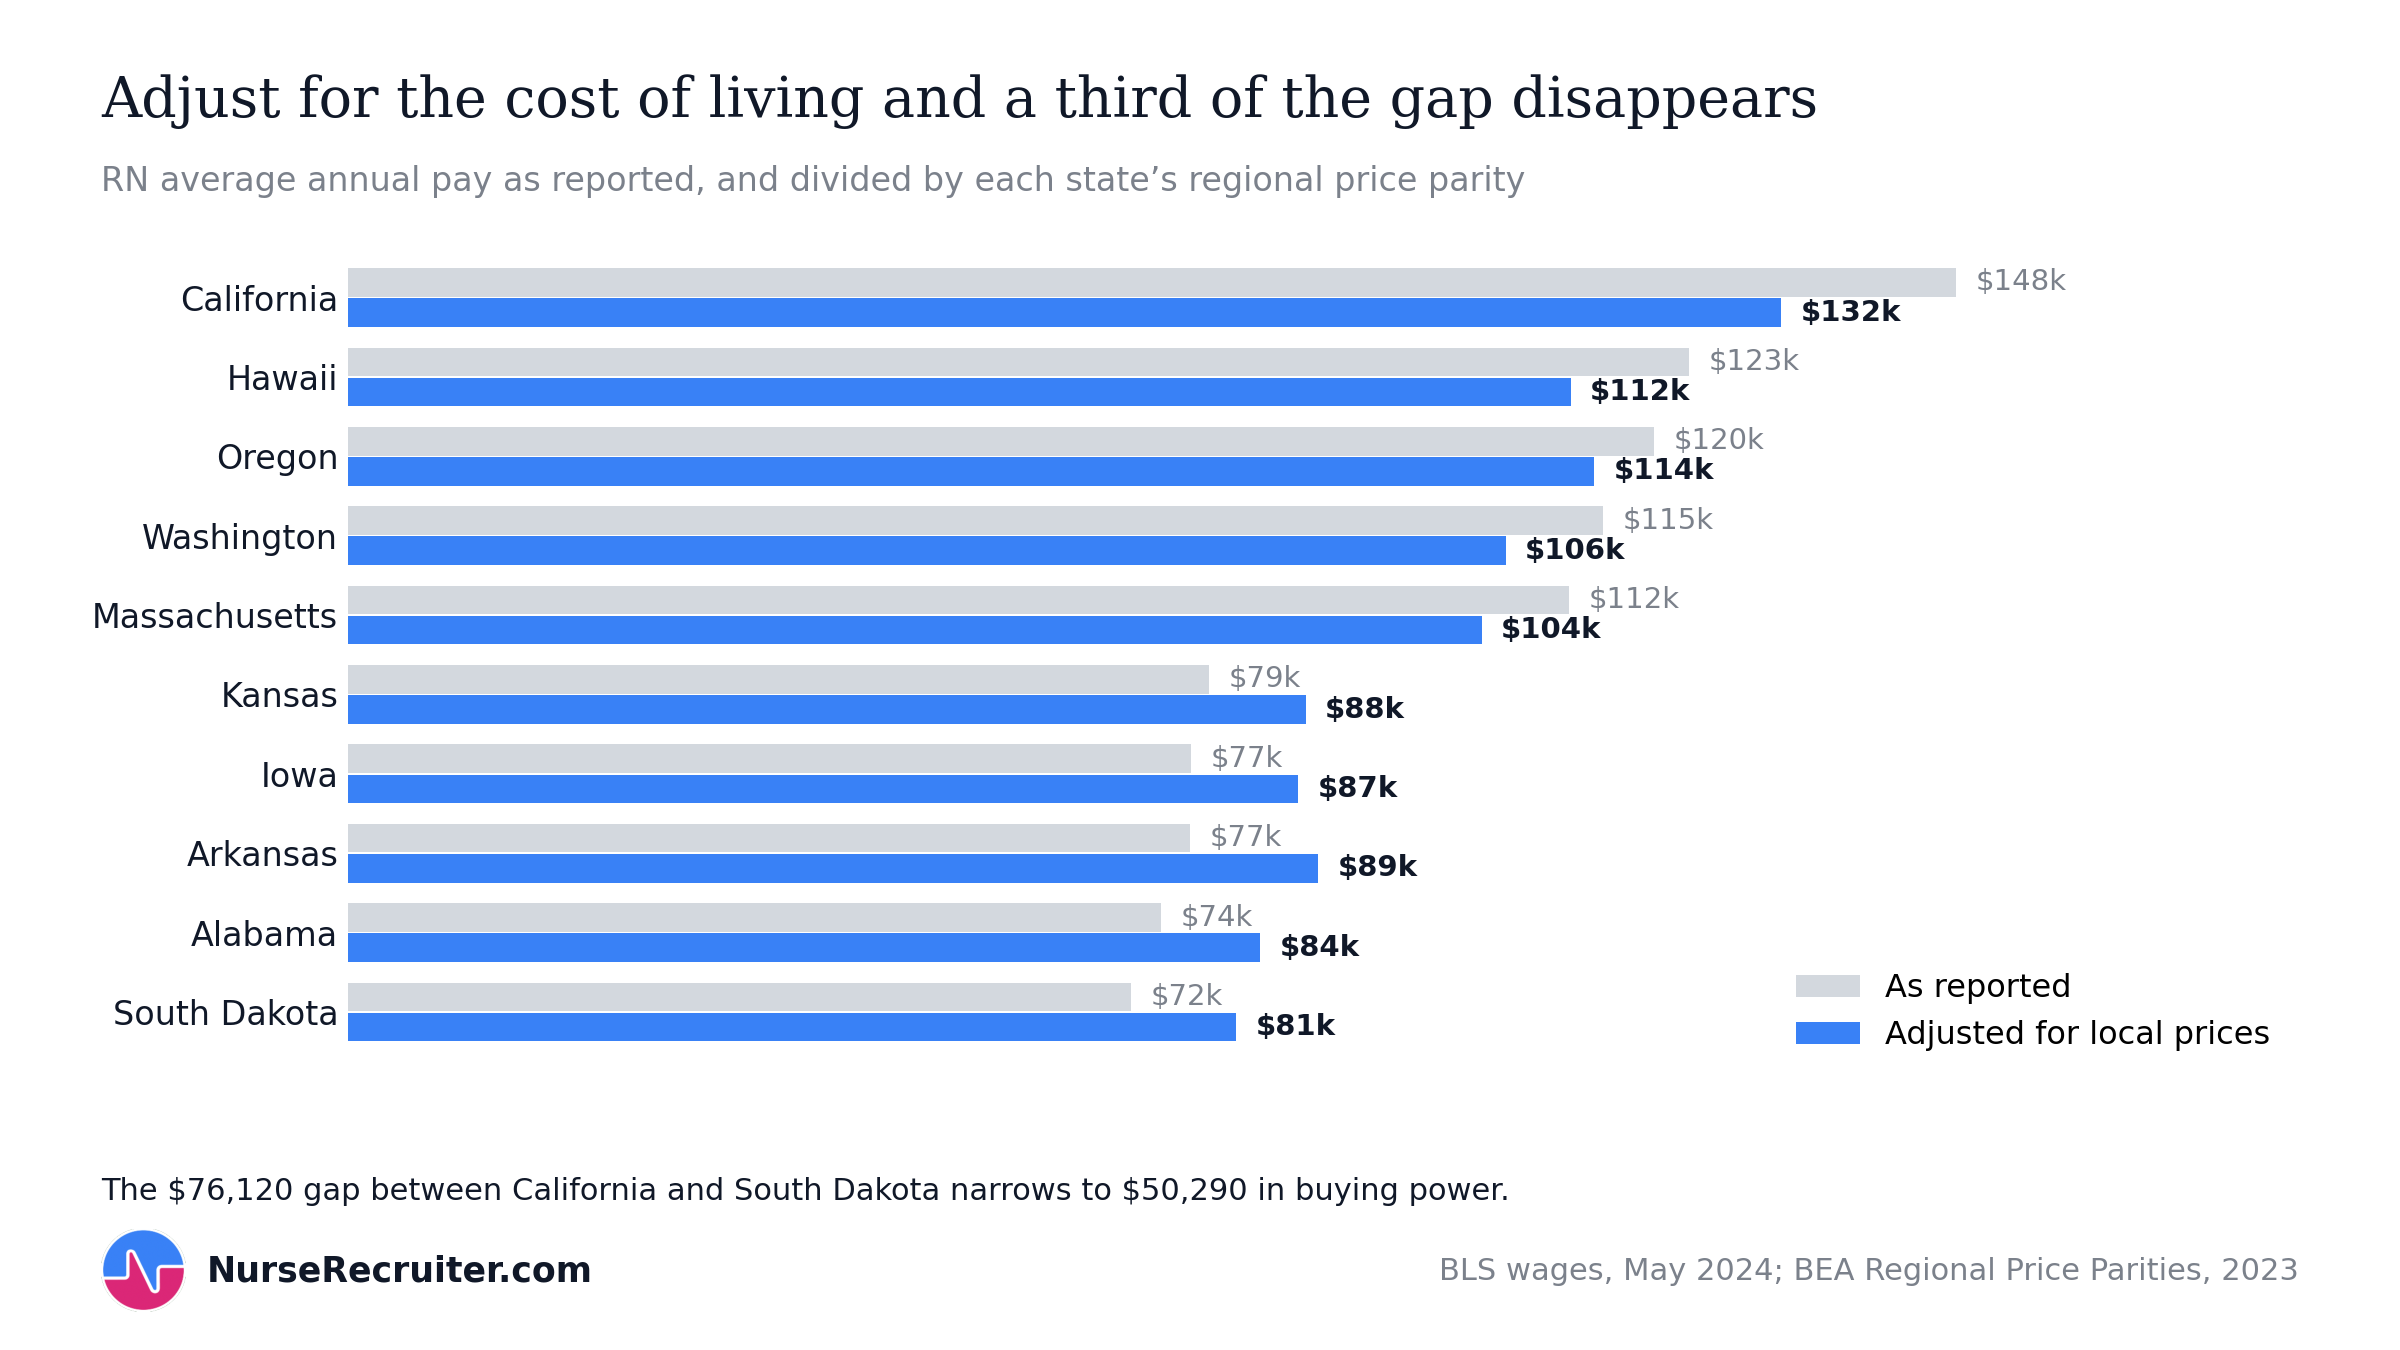
The correction is real, and it is big. That $76,120 chasm between California and South Dakota shrinks to $50,290 in buying power, so about a third of the gap simply evaporates. Every low-paying state gains. South Dakota's $72,210 lives like $81,918, and Arkansas jumps the furthest, from $77,720 to the equivalent of $89,529, overtaking three states that pay more on paper.
But note what does not happen. The gap narrows; it does not close. California still leads on buying power at $132,208, and every one of the five lowest-paying states still trails every one of the five highest. The cost-of-living argument is a real deduction from the California premium. It is not a refutation of it.
The twelve best-paying metro areas in America are all in California
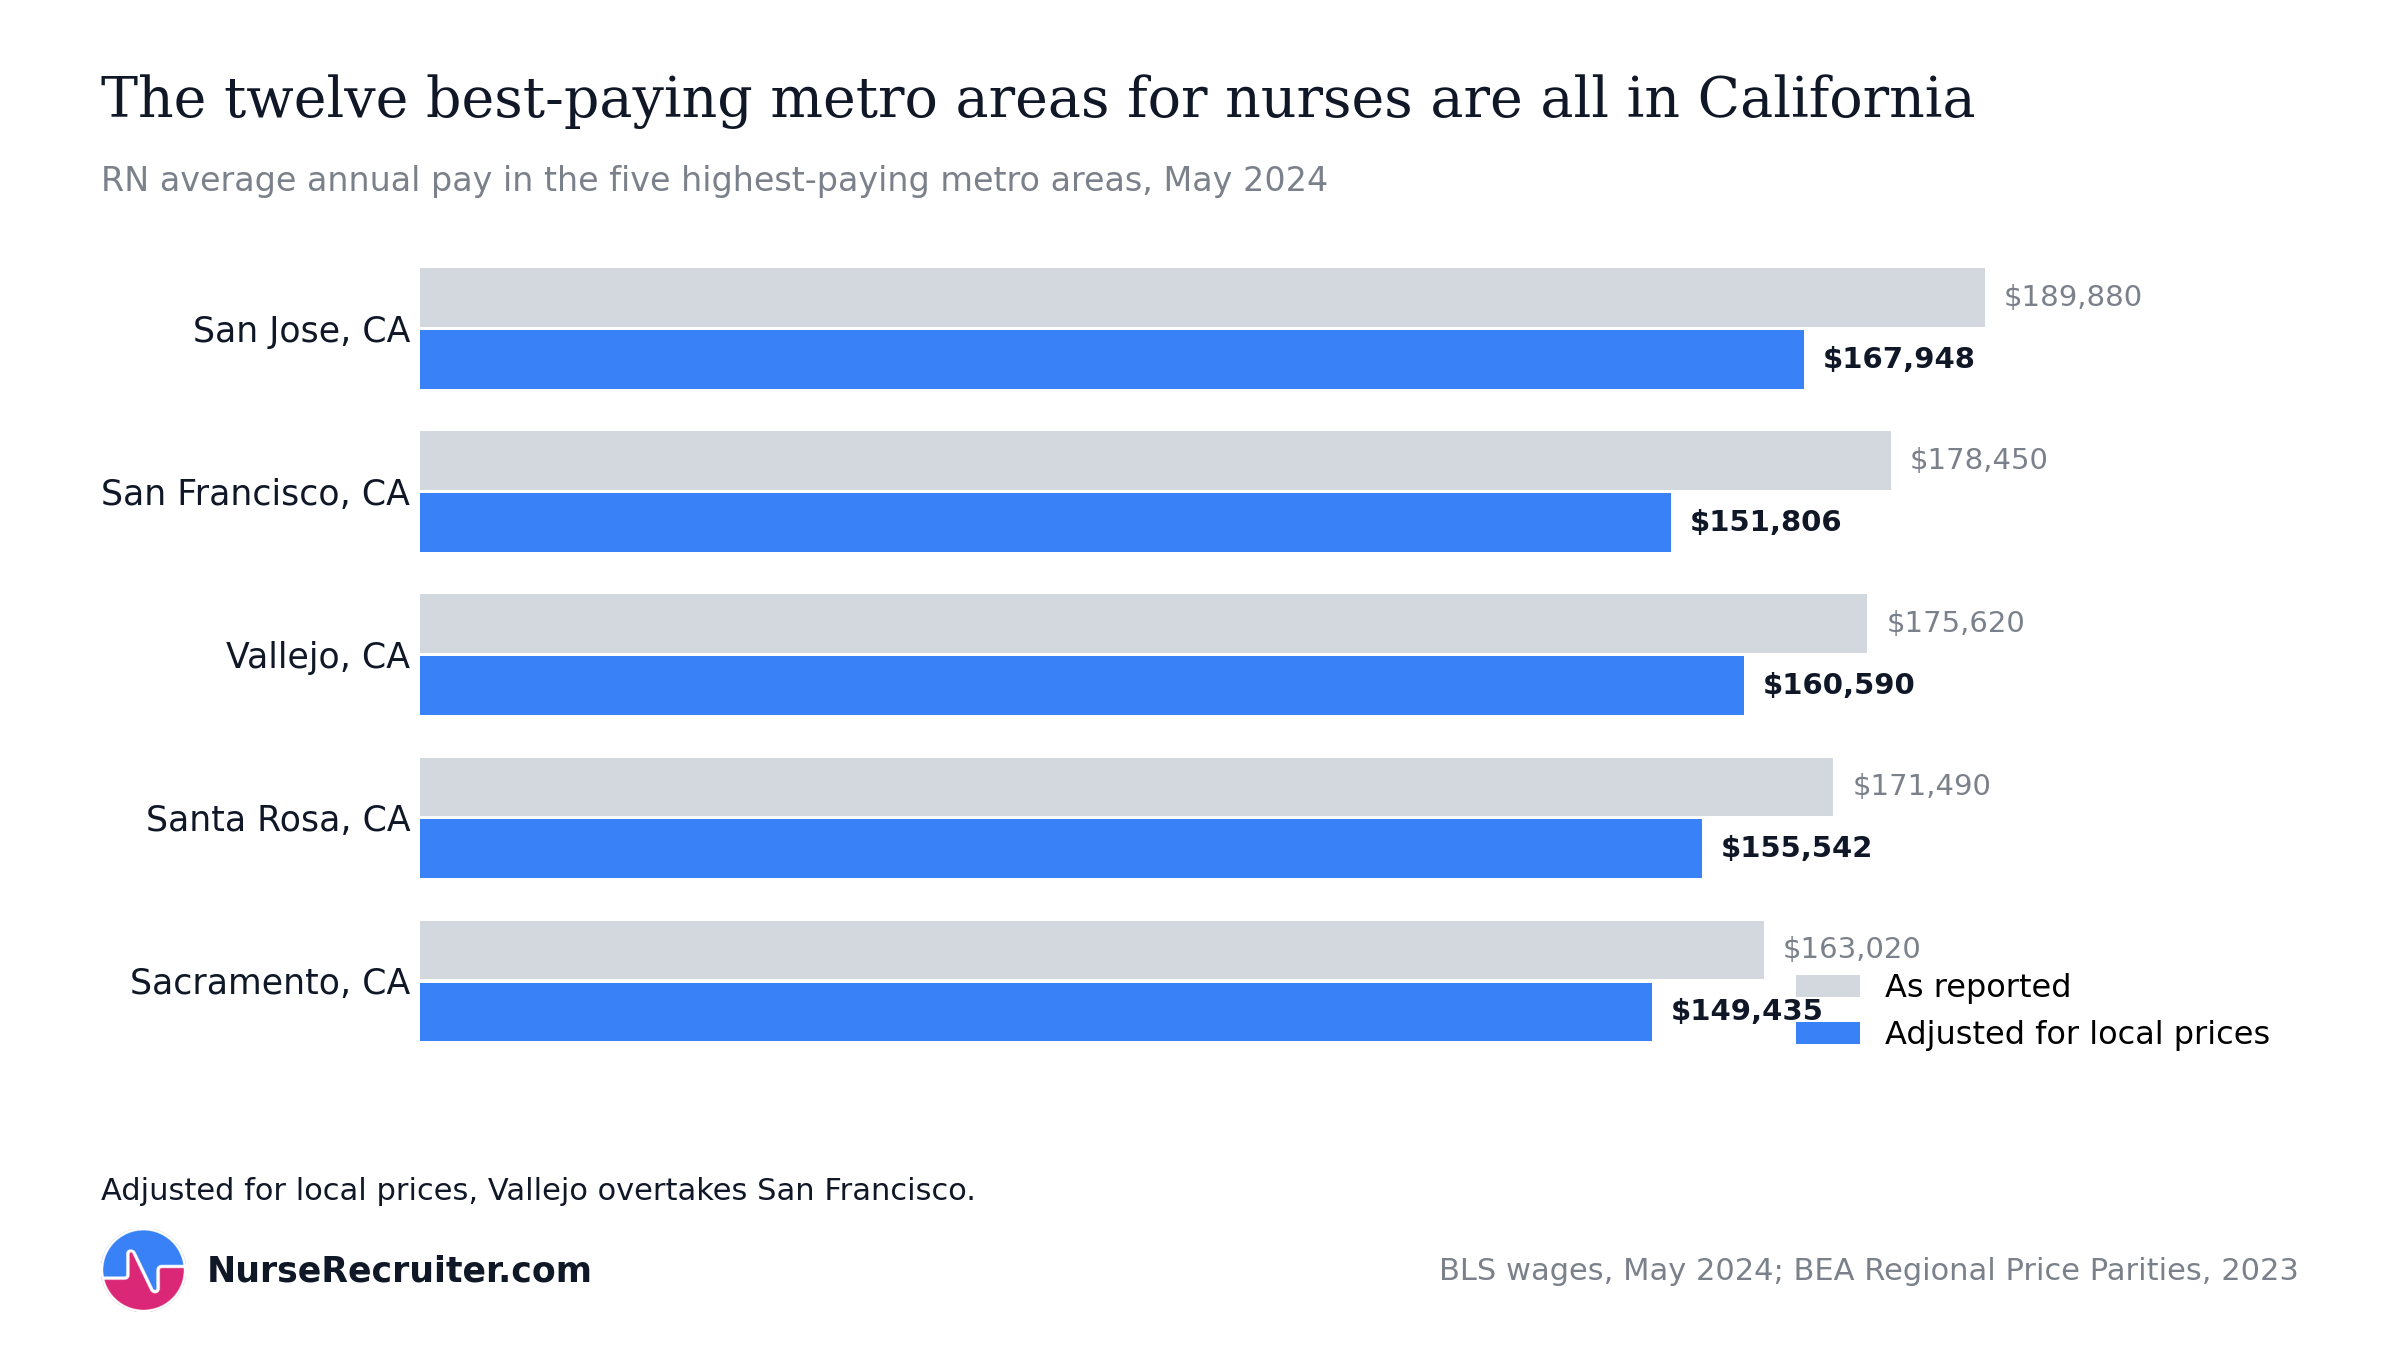
Not the top three. The top twelve. You have to go a long way down the national list before you leave the state.
San Jose leads the country at $189,880, followed by San Francisco ($178,450), Vallejo ($175,620), Santa Rosa ($171,490) and Sacramento ($163,020).
Adjust for prices and the order shuffles in a way that is worth knowing if you are choosing between Bay Area assignments. San Jose stays on top at an adjusted $167,948. But Vallejo overtakes San Francisco, $160,590 against $151,806. Same region, an hour apart, and the cheaper city hands you nearly nine thousand dollars a year more in real terms. Santa Rosa also passes San Francisco once you account for what a dollar buys.
If you would rather work where the jobs are than where the rate is highest, the biggest RN employers are a different list. New York-Newark-Jersey City has 195,470 nurses at an average of $115,650, Los Angeles has 107,340 at $138,010, and Chicago has 100,620 at $94,580. By state, California employs the most nurses (326,720), then Texas (261,050), Florida (218,100), New York (204,120) and Pennsylvania (146,840).
What to actually do with these numbers
Three things.
Use them as a floor, not a forecast. These are averages of what employers already pay. When you see a posting in your metro, you now know whether it sits above or below the local going rate, and that is the single most useful thing to know before anyone says a number out loud.
Weigh the move properly. A $20,000 raise that comes with a $25,000 cost-of-living increase is a pay cut with extra paperwork. The buying-power chart above is the honest version of the comparison, and it is why Vallejo quietly beats San Francisco.
Remember these are staff wages only. If you take travel contracts, none of the above is your ceiling. See our travel nursing assignments for what those pay instead.
One last thing worth flagging, and it is the same one as last year. The best-paying state in the country is also one of the last holdouts refusing to join the multistate licensure compact. If you want to nurse in California, you need a California license, full stop. Whether walling the state off from out-of-state nurses is part of why the pay is so good is a question we will happily leave in the comments.
And the standard caveat, because we would rather say it than have you find out the hard way. BLS itself warns against reading its year-to-year changes as pure wage growth, because the survey sample and job coding shift between releases. Treat the direction as solid and the decimal points as approximate.
Averages are averages, and you are not an average. Browse the RN listings, look up your own city on our locations pages, and go find the pay you deserve.