
A sample is the group actually studied. The target population is the group a conclusion is intended to describe. Representativeness concerns whether the sampling and participation process supports that description. A large sample can still miss important groups or overrepresent people whose experiences differ from those who did not participate.
Begin by separating the target population, the list or route used to reach people, the invited group, and the respondents. These may be four different populations.
Trace who could participate
For a survey about nursing work, determine whether recruitment reached all relevant license types, settings, employment arrangements, shifts, and locations. These are questions to investigate, not a requirement that every study represent every nurse. A study can appropriately focus on one defined group if its conclusions remain within that scope.
A hospital's employee email list may fit a question about current employees. It would not, by itself, provide a way to study nurses who already left the hospital. The recruitment route should match the question.
An illustrative denominator problem
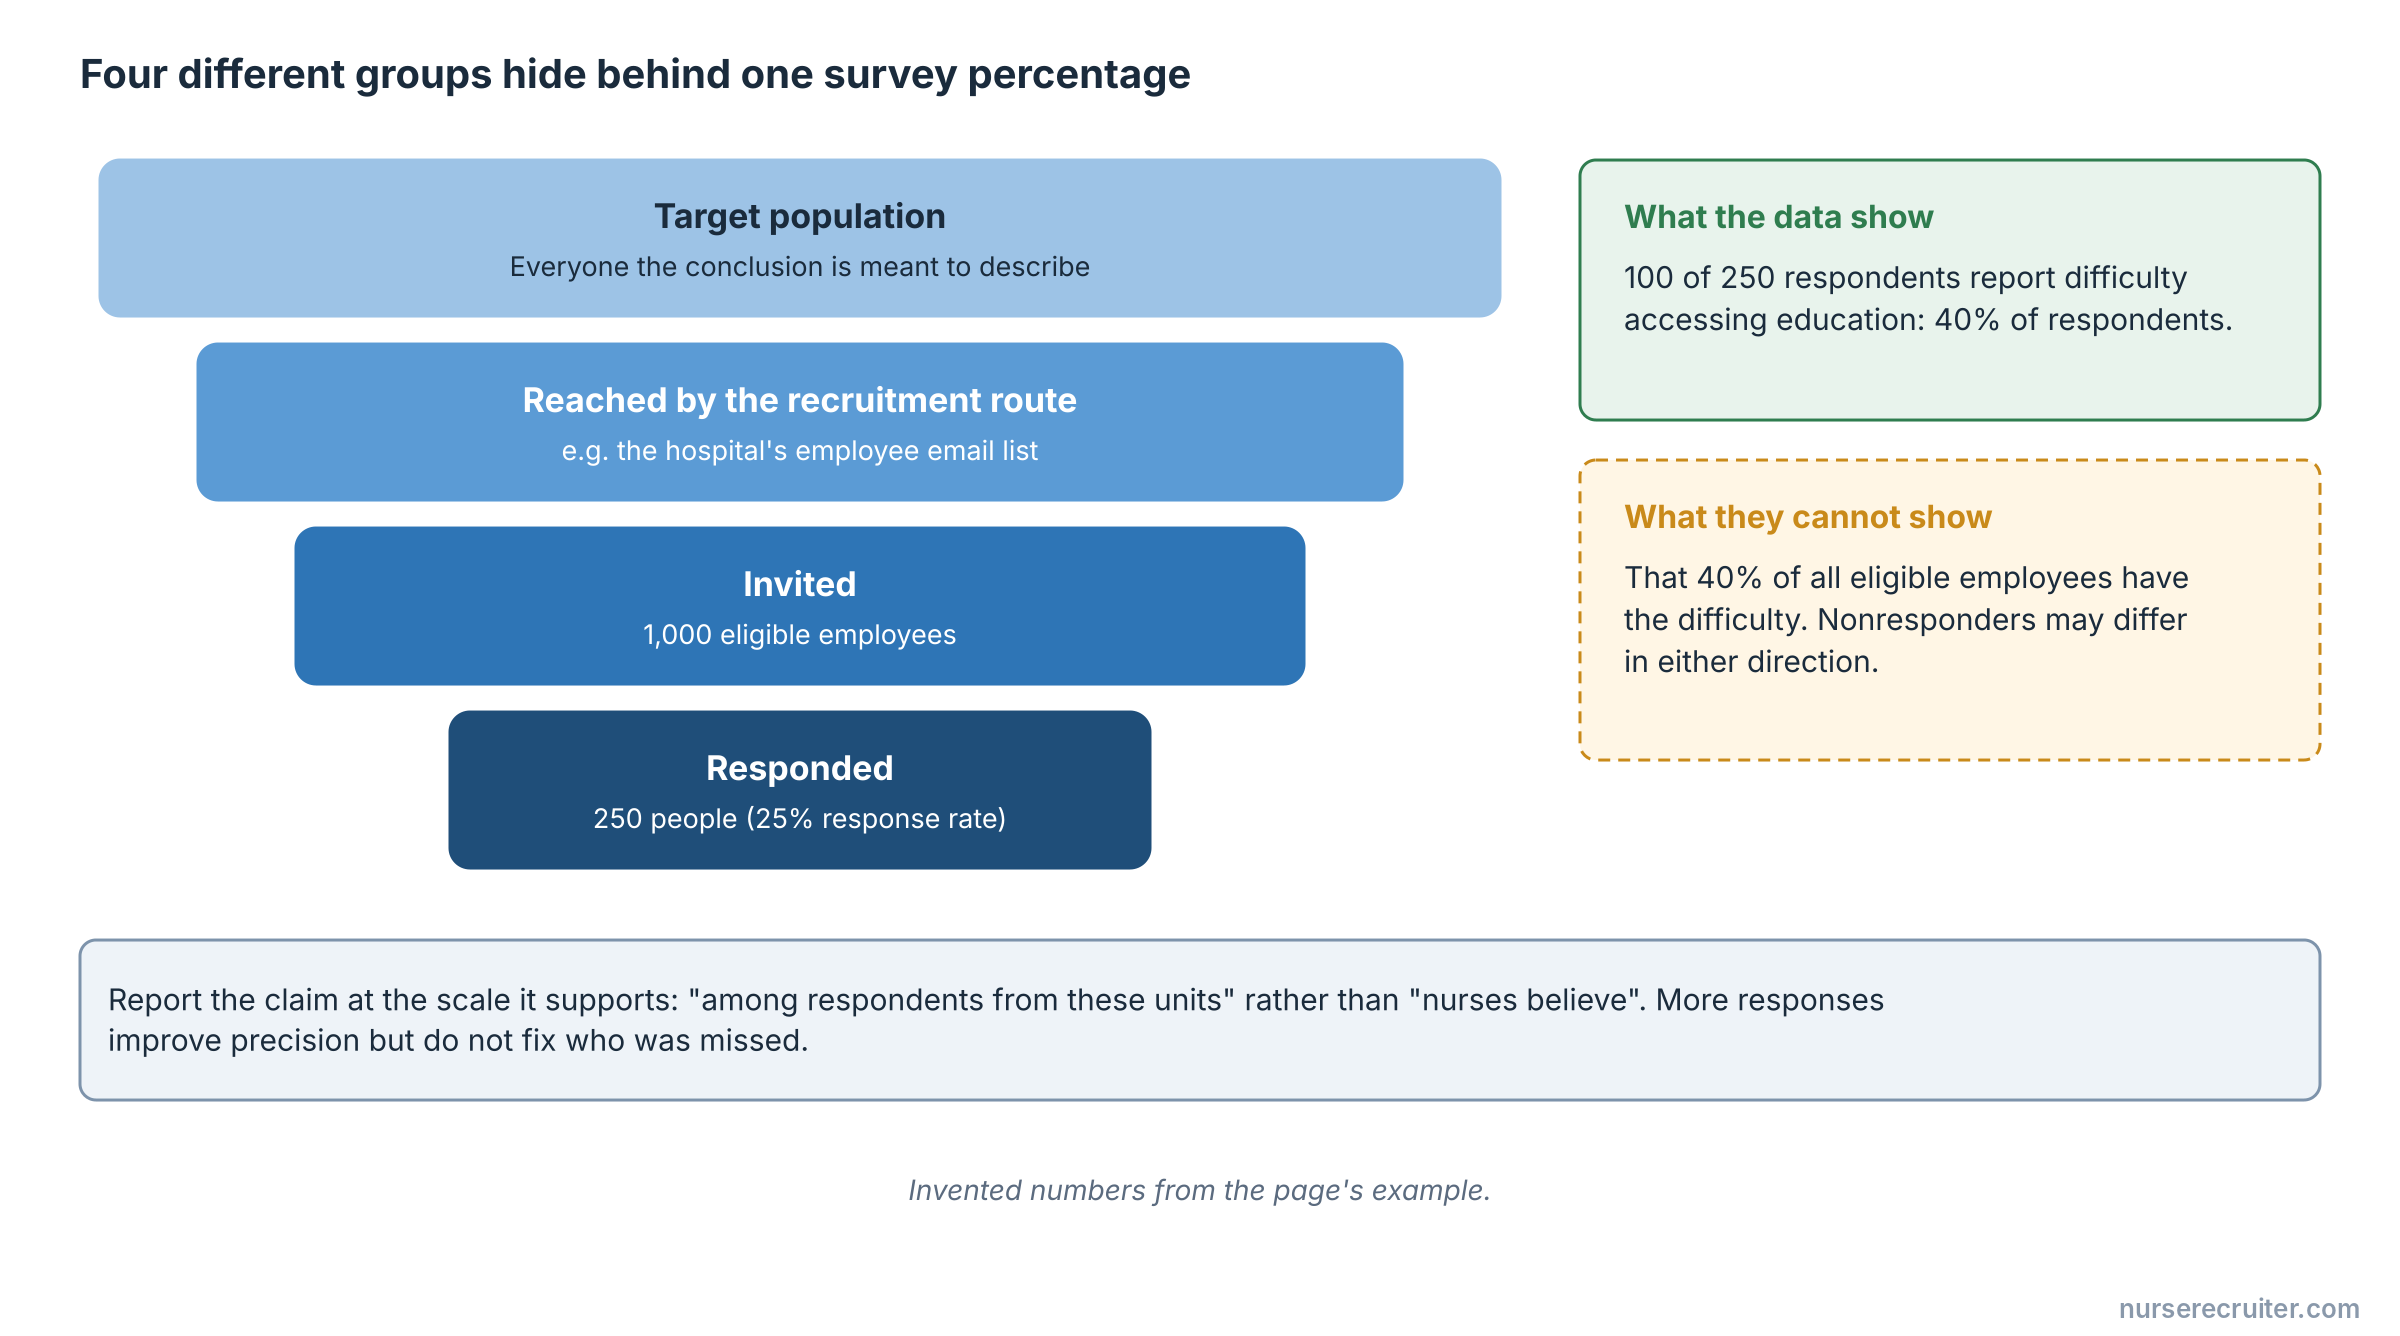
Suppose 1,000 eligible employees receive a survey invitation and 250 respond. Among respondents, 100 report difficulty accessing education. That is 40% of respondents and a 25% overall response rate, assuming all invitations reached distinct eligible employees and all 250 met the completion definition.
It is not evidence that 40% of all eligible employees have the difficulty. If people with access problems were more likely to respond, the estimate might be too high; if they were less able to participate, it might be too low. The example cannot establish which explanation is correct.
Ask what the analysis can repair
Study authors may use weighting or other adjustments to account for aspects of a sampling design or known differences in response. Ask what information supported those adjustments and which groups still lack adequate coverage. An adjusted result should not be treated as proof that every unmeasured difference was removed.
Likewise, a narrow confidence interval describes one form of statistical uncertainty. It does not automatically include errors caused by missing groups, unclear questions, or inaccurate responses. More responses can improve precision without fixing a flawed recruitment process.
Preserve useful boundaries
A small study can still reveal a practical issue or generate a research question. Report it at the scale it supports. “Among respondents from these units” is more informative than quietly changing the claim to “nurses believe.”
When assessing a paper, write one sentence naming who was reached and another naming who may be missing. Then explain whether the gap matters for the intended decision. This makes limitations concrete without dismissing the study merely because it is imperfect.
See cross-sectional nursing surveys for interpreting item denominators and research generalizability for applying findings elsewhere.
When explaining a survey percentage to a patient, techniques for communicating about health numeracy can help keep the denominator visible.
Sources
- CDC Field Epidemiology Manual: Collecting Data (accessed 2026-09-17).
- NIST: Confidence Limits for the Mean (accessed 2026-09-17).
- CDC Field Epidemiology Manual: Analyzing and Interpreting Data (accessed 2026-09-17).