
A Pareto chart displays categories from the largest contribution to the smallest, helping a team see where a problem is concentrated. IHI describes it as a tool for focusing improvement efforts and explaining the choice of priorities. The bars may represent counts or another clearly specified magnitude; a cumulative percentage line shows how much the leading categories contribute together.
The chart summarizes categories, not change over time. Use a run chart when the question concerns a sequence of observations. A large Pareto bar identifies a substantial recorded category; it does not establish an underlying cause.
Define the categories before counting
IHI's instructions begin with a table of factors and their magnitudes, ordered from largest to smallest. The percentage for each category is its contribution divided by the total, multiplied by 100. The cumulative percentage adds those percentages in descending order.
For a practical local analysis, specify the observation period, data source, and counting unit. Decide whether the table counts incidents, affected patients, recorded reasons, or something else. If one incident can receive several labels, explain that the total represents labels rather than unique incidents. Otherwise the reader may misunderstand the denominator.
Write category definitions and review ambiguous cases before drawing the chart. Keep an “unknown” category visible when information is missing. If several small categories are grouped as “other,” retain the underlying detail so that a later reviewer can examine what the summary hides.
Illustrative calculation
Imagine 40 hypothetical administrative request records, each assigned one mutually exclusive reason for being returned: 18 lack a destination, 12 lack a contact, 6 contain an unreadable attachment, and 4 have another reason. These numbers are invented solely to demonstrate the calculation.
| Reason for return | Records | Share of 40 records | Cumulative share |
|---|---|---|---|
| Missing destination | 18 | 45% | 45% |
| Missing contact | 12 | 30% | 75% |
| Unreadable attachment | 6 | 15% | 90% |
| Other | 4 | 10% | 100% |
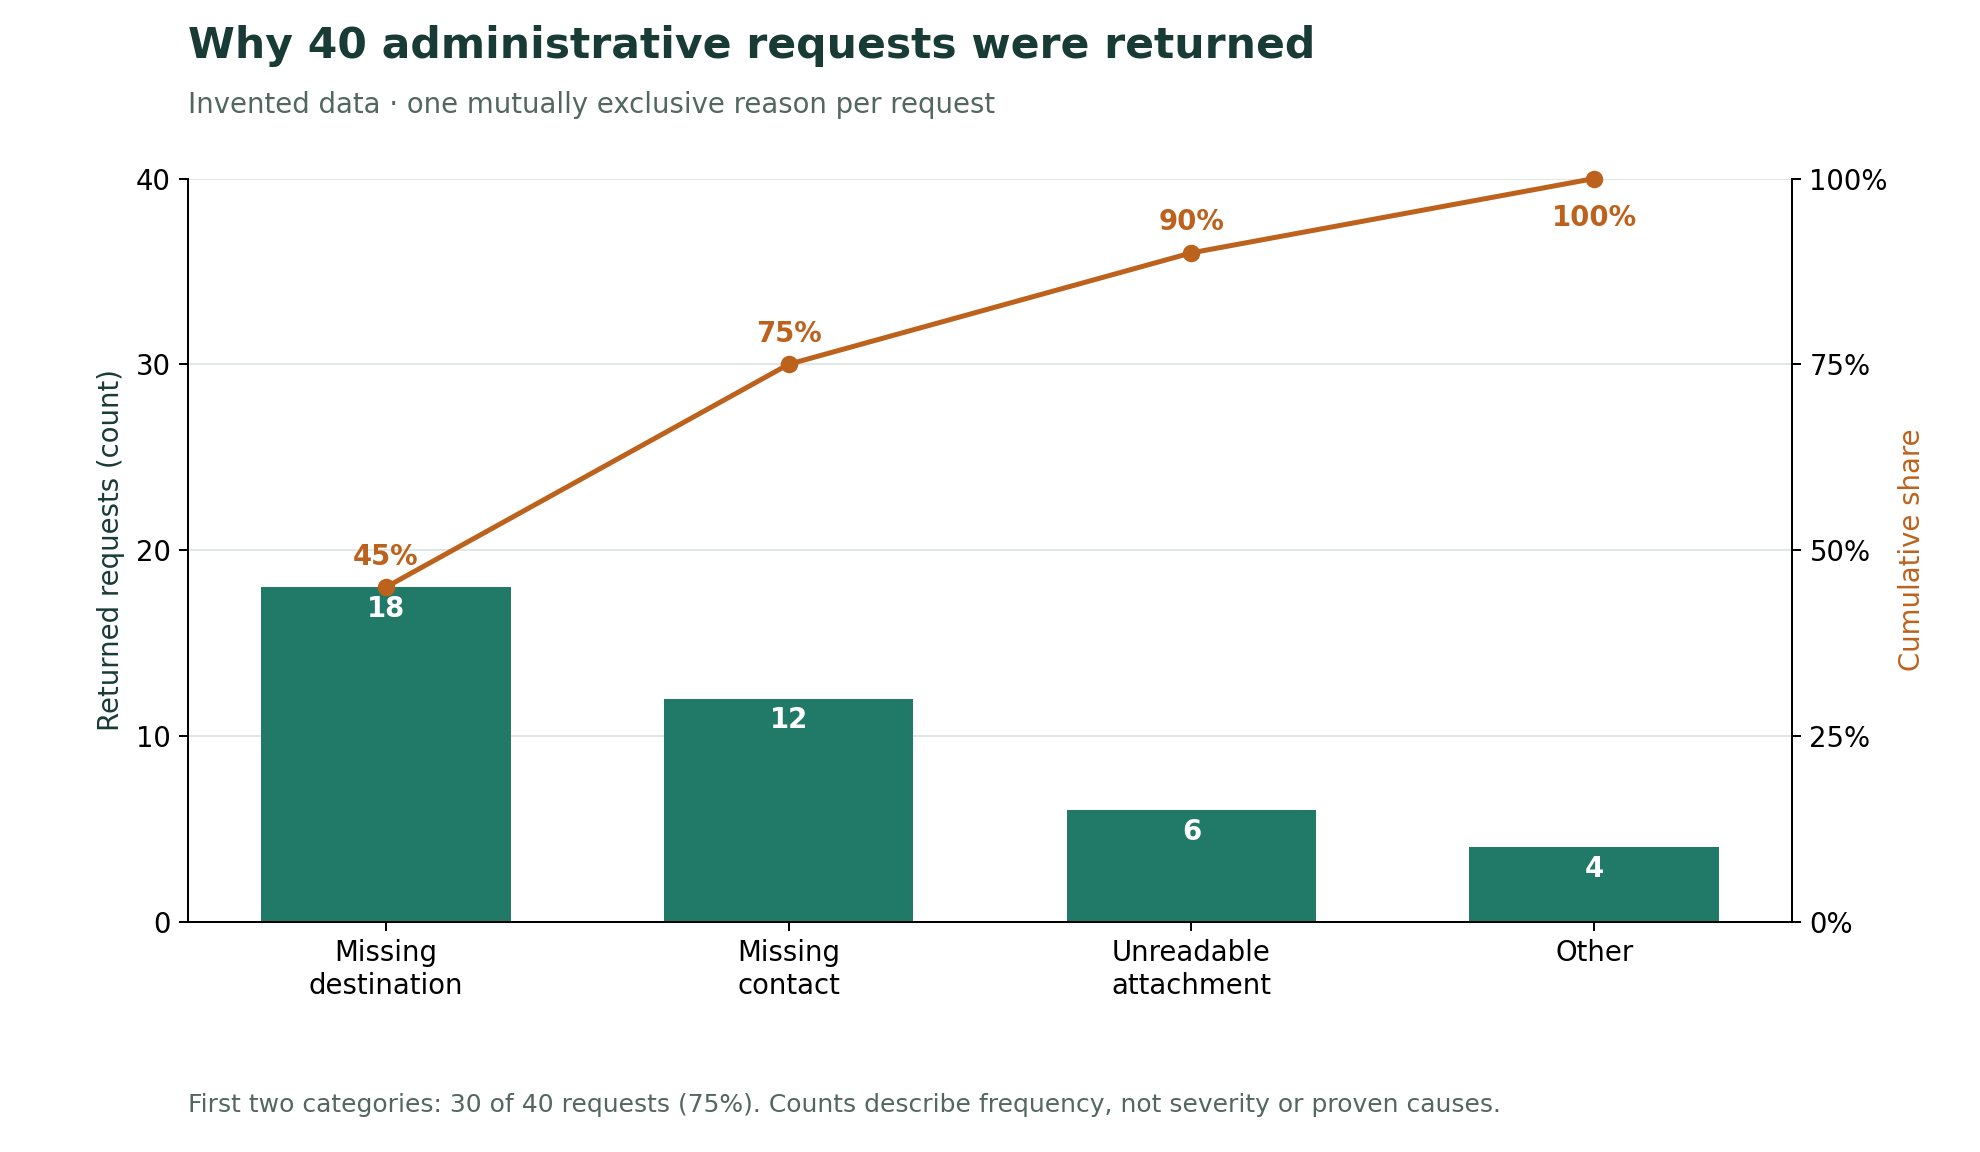
The percentages are 45%, 30%, 15%, and 10%. The cumulative percentages are 45%, 75%, 90%, and 100%. The first two categories account for 30 of 40 records, or 75%. That result supports examining those categories first if reducing returned requests is the chosen aim. It does not show that fixing two fields will necessarily eliminate those returns.
Choose priorities beyond the tallest bars
The familiar “80/20” label is not a requirement that the observed data must satisfy. In the example, half the categories account for three quarters of the records. Report the actual distribution rather than adjusting category boundaries to manufacture a particular pattern.
Frequency and severity are different questions. A chart of return counts contains no measurement of harm, so it cannot justify dismissing a rare but serious issue. Review such concerns separately and examine whether the largest category is broad simply because several different problems were grouped together.
After choosing a priority, investigate its mechanisms and consider small tests of change. A later chart can describe a new distribution, but an altered mix of categories alone does not demonstrate that the overall problem became less frequent. Keep the total and observation period alongside the chart.
Before prioritizing the largest category, consider whose experiences may be missing from the count.
Sources
- IHI: Pareto Chart (accessed 2026-09-17).