
A run chart displays a measure in time order so a team can examine how its process changes. It can show patterns hidden by a single before-and-after average and can mark when a new practice, staffing change or other event occurred. The chart supports investigation; its shape alone does not establish why a change happened.
Start with a stable definition
Choose a measure whose meaning stays consistent across the chart. If the measure is the percentage of discharge records with verified contact information, define both the qualifying records and what “verified” means. Document how missing records are handled.
Use a consistent time interval and show what each point represents. Ten discharges in one week and 80 in another may produce percentages that look equally substantial on the page, even though the underlying numbers differ. Keep those denominators available to the people interpreting the chart.
Do not replace a missing observation with zero. A week in which no data were collected is different from a week in which the measured event did not occur.
Add context without declaring causation
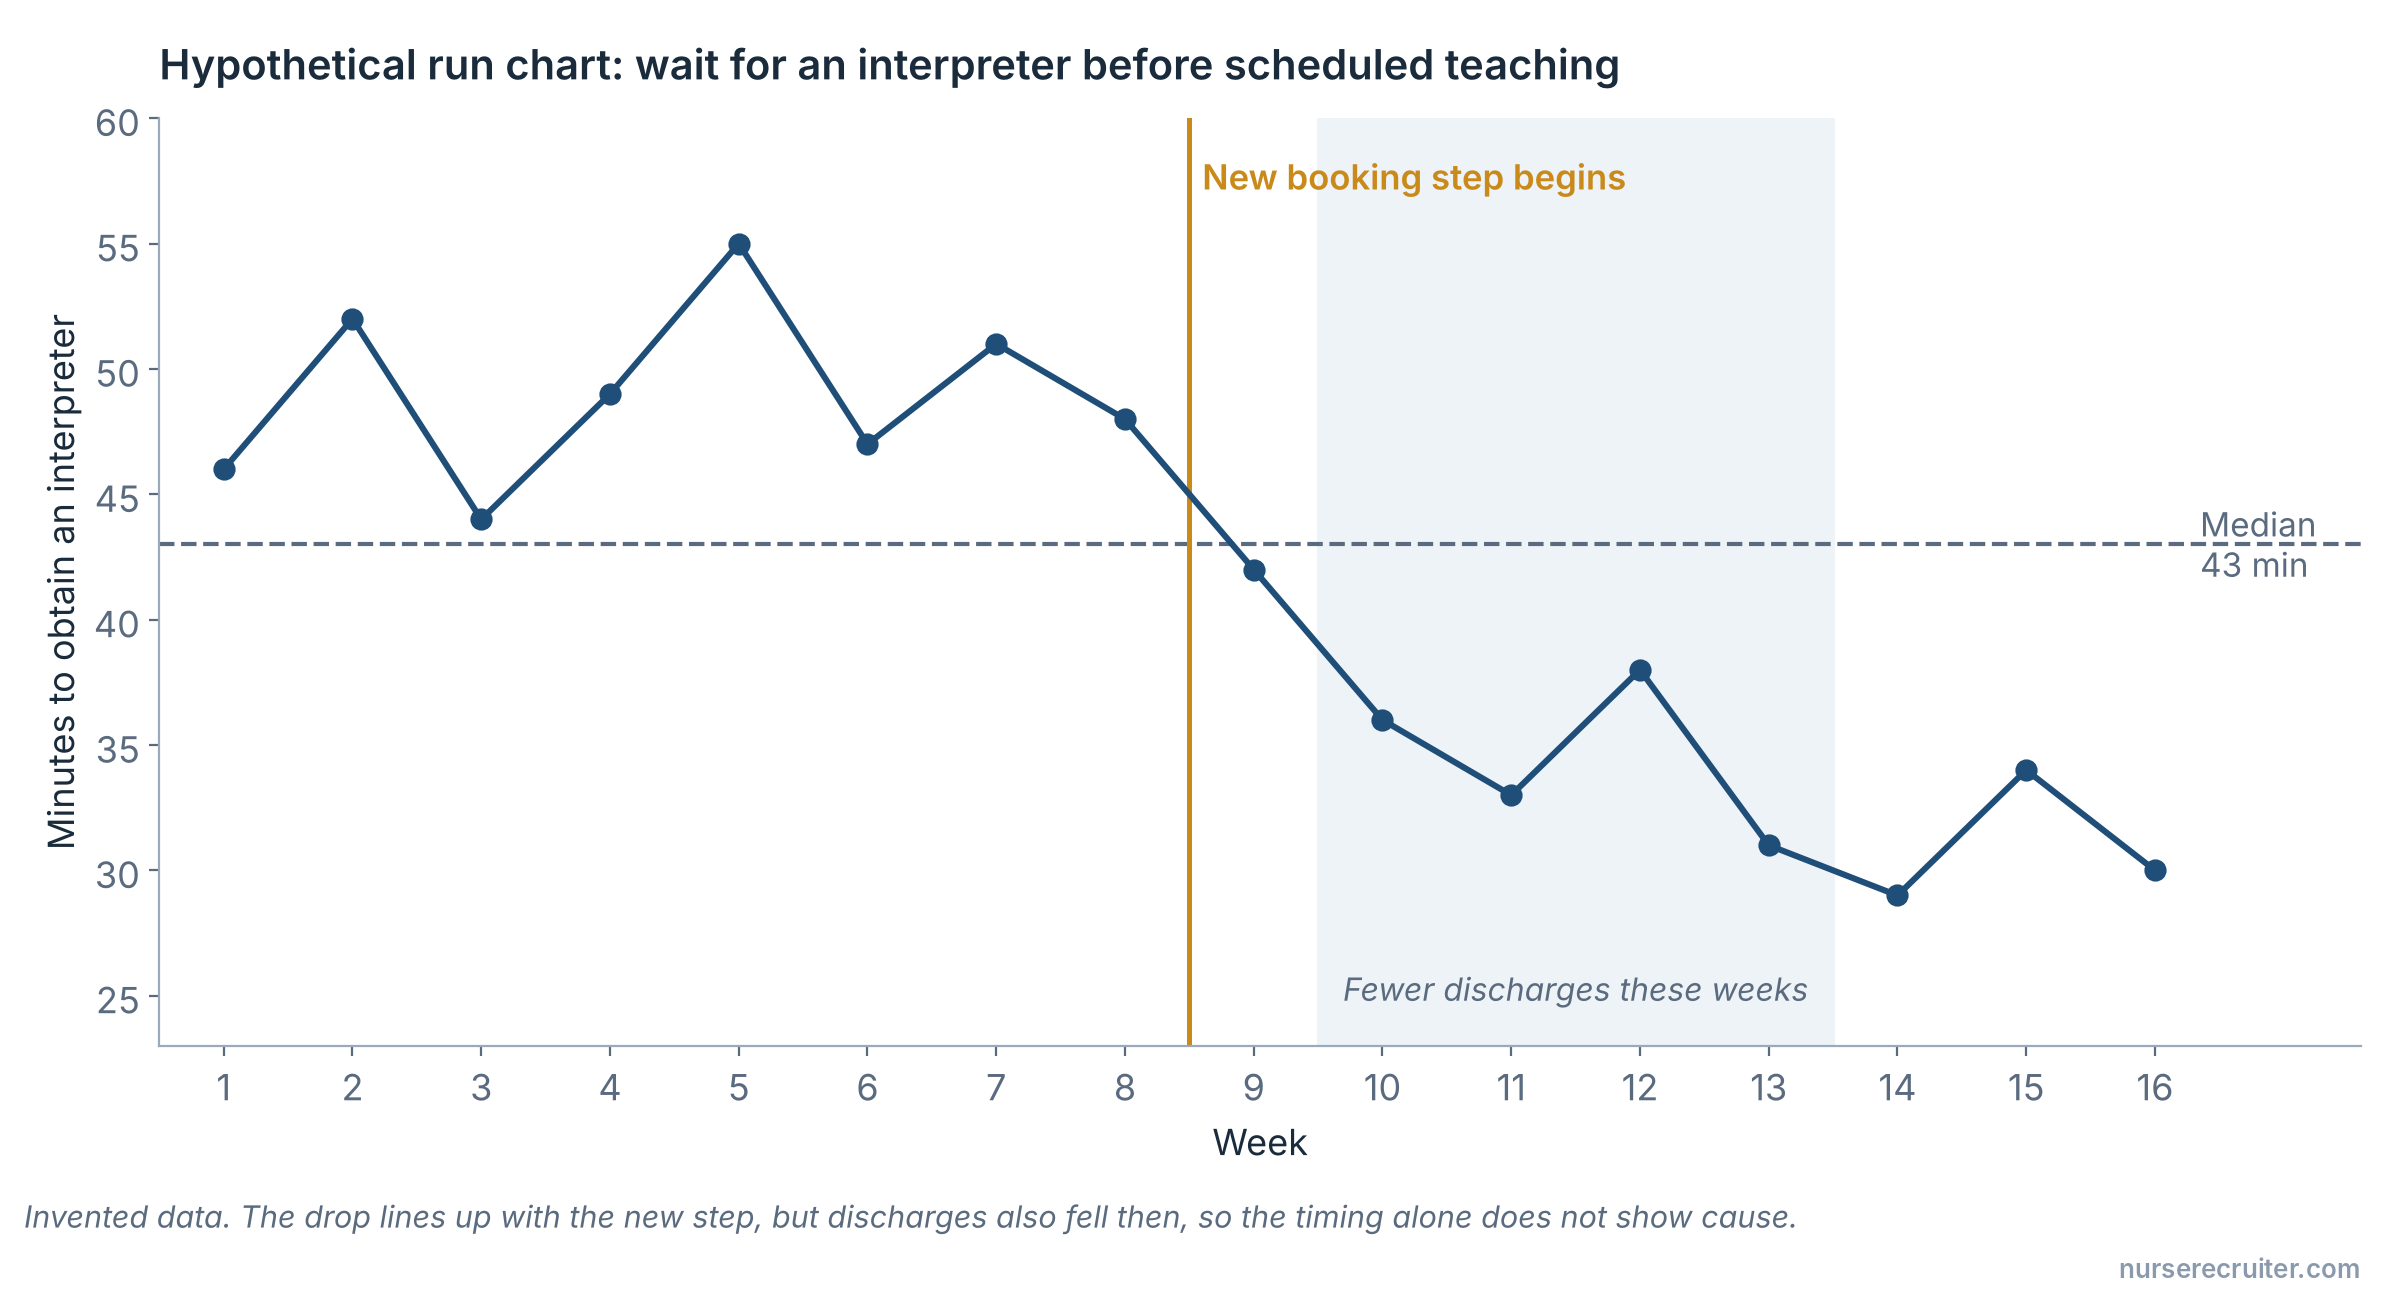
Annotations can identify when a test started, when the measurement method changed or when an unusual event affected the service. The purpose is to preserve context for interpretation.
For example, imagine a hypothetical chart of the time required to obtain an interpreter for scheduled teaching. Waiting time falls after a new booking step begins, but the same month also has fewer discharges. The timing supports further investigation of the booking change; it does not by itself isolate the change's effect.
A team could examine whether the pattern persists during busier periods, whether definitions changed and whether the improvement applies across languages or shifts. Those questions are more informative than adding a “success” label after the first favorable point.
Add a median reference line
IHI’s run-chart instructions call for a median line when there are at least ten plotted observations. To find the median, order the values by size and identify the middle value; for an even count, average the two middle values. Calculate from the values, but keep the chart itself in time order. Record which observations define the line so another reader can reproduce it.
Use interpretation rules deliberately
Run-chart methods use specified rules to examine patterns. Choose a recognized method and document it before interpreting the results. Avoid selecting a different rule each time because it produces a more encouraging conclusion.
If the team needs control limits and a formal assessment of process stability, it may need a control chart. Run charts and control charts are related tools, but the terms should not be treated as interchangeable.
Keep the underlying data
The picture should be reproducible from a saved table. Include the measure definition, reporting period, data source and collection method with the chart. A clear chart can still mislead if the data behind it omit a shift or silently exclude difficult cases.
IHI provides instructions and a run-chart template; AHRQ PSNet explains time-based displays in patient safety. Use the selected method consistently and preserve the data behind the picture.
See also selecting improvement measures.
If performance differs across groups, consider how to compare the data equitably as well as how they change over time.
Sources
- IHI — Run Chart Tool (accessed 2026-09-17).
- IHI — Run Chart Instructions (PDF) (accessed 2026-09-17).
- AHRQ PSNet — Tracking Improvements in Patient Safety (accessed 2026-09-17).
- NIST — Measures of Location (accessed 2026-09-17).