
Statistical process control, or SPC, uses time-ordered data to examine the variation in a process. Control charts help a team distinguish variation associated with the existing system from signals that warrant investigation for a particular change or circumstance. They add an analytical structure to questions that a dashboard's red and green arrows cannot answer on their own.
Control limits are not targets
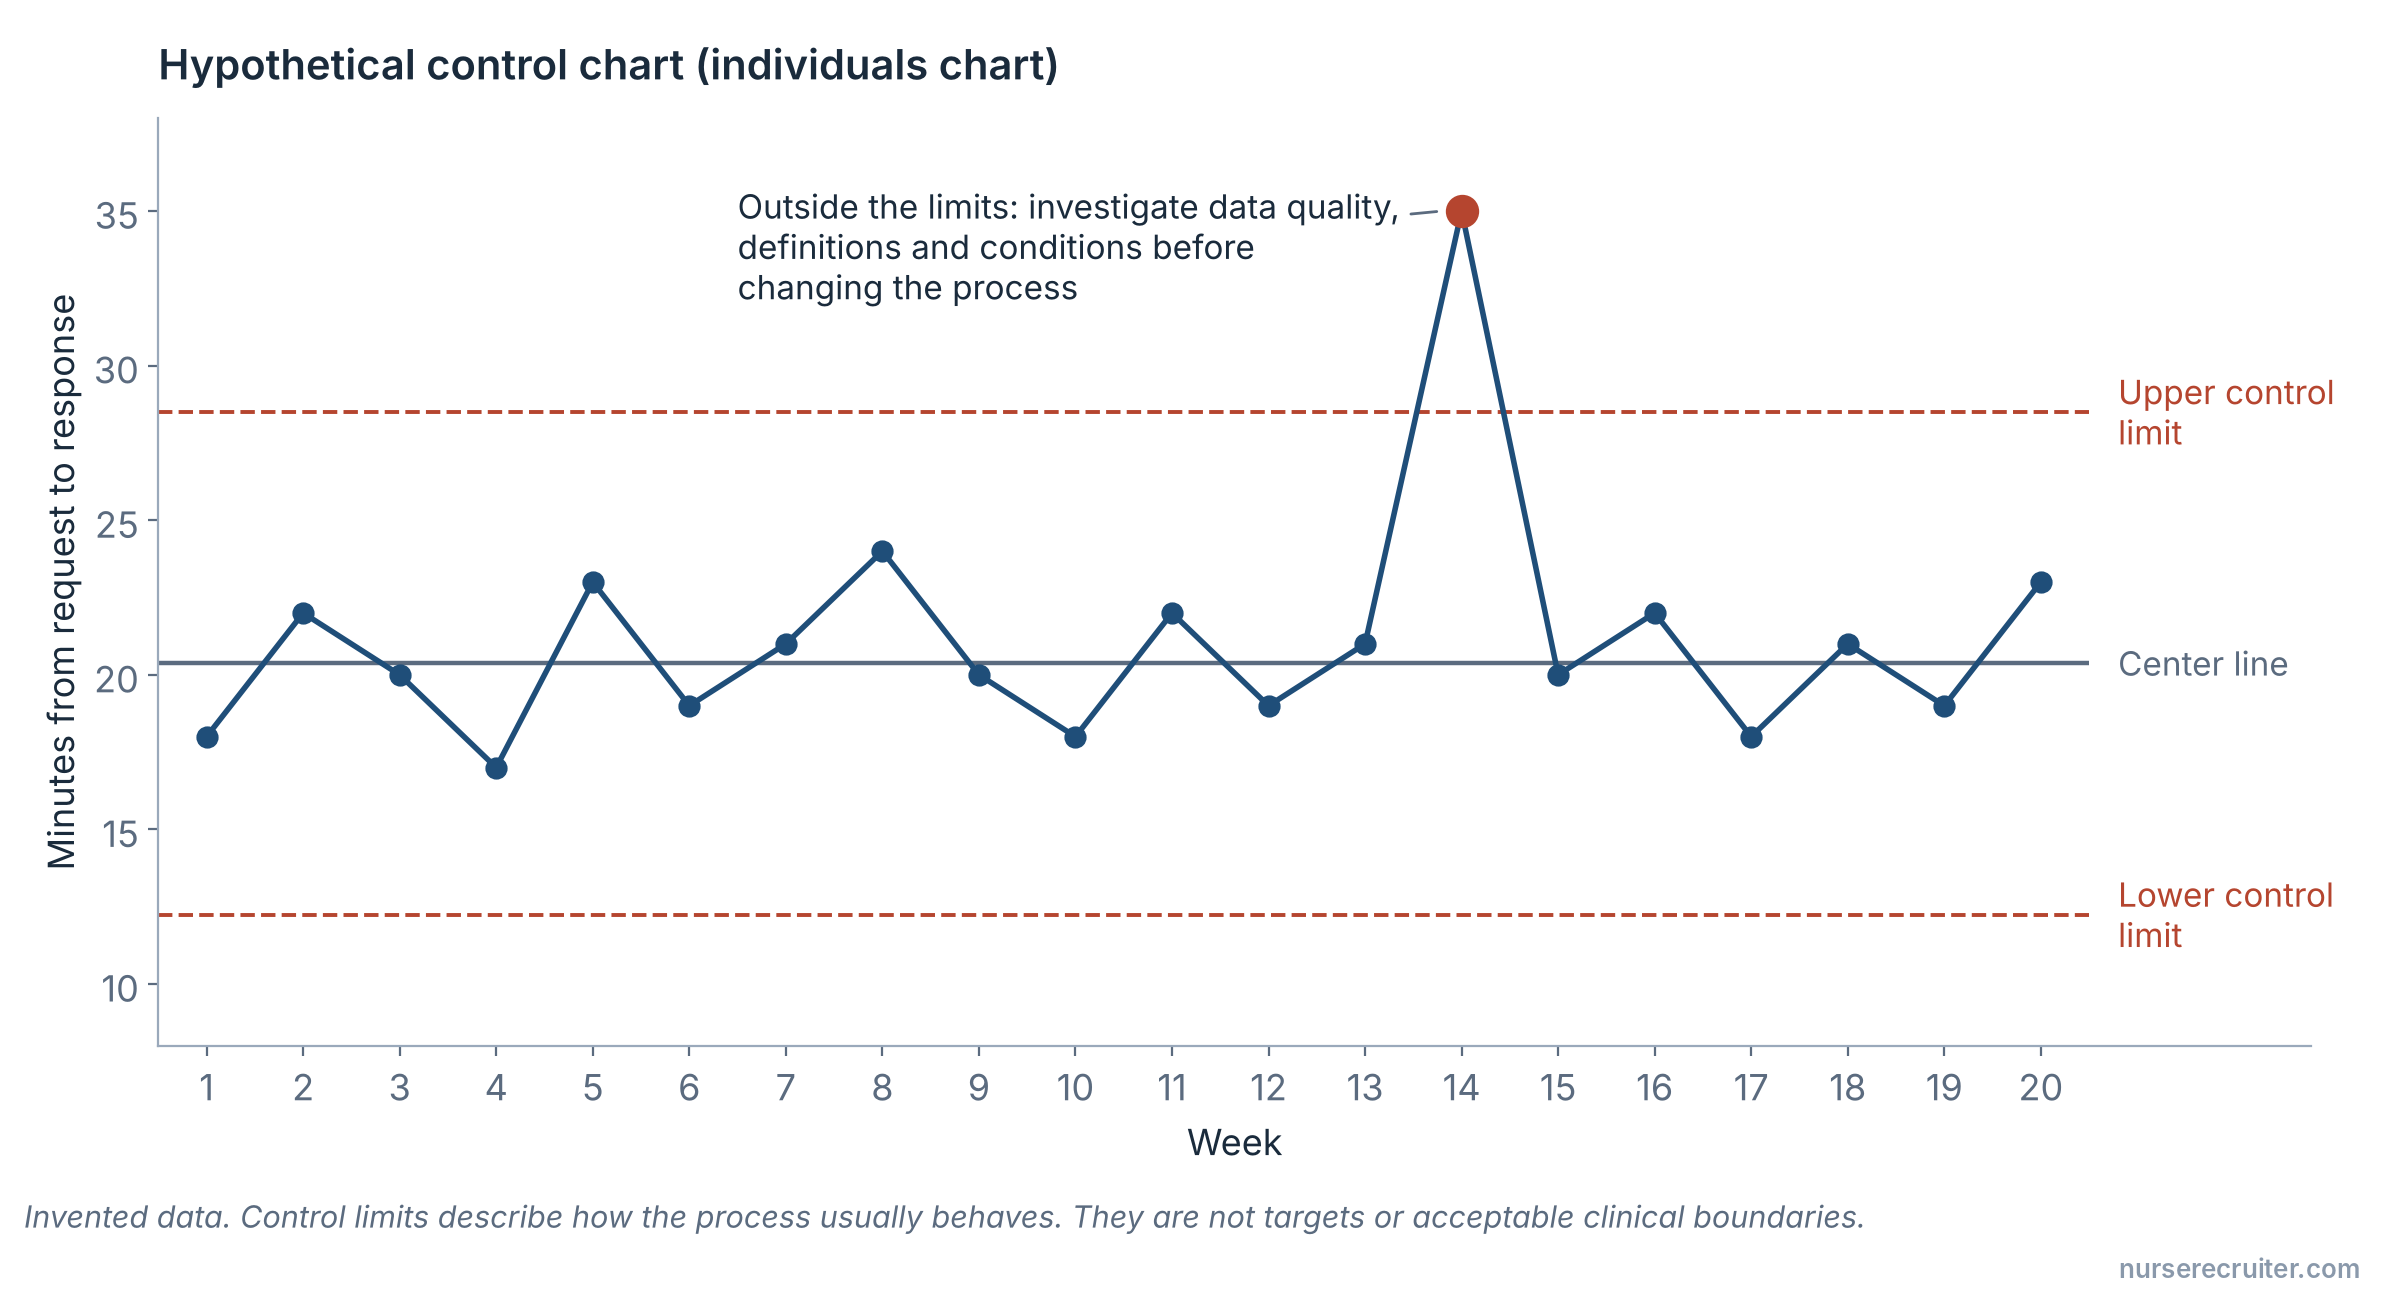
A control chart generally includes a center line and calculated control limits. Those limits describe the expected behavior of the measured process under the chart's assumptions. They are not automatically acceptable clinical boundaries, contractual requirements or improvement targets.
A process can be stable and still perform poorly. If a unit consistently experiences a long delay, a chart may show a predictable problem rather than an occasional exceptional event. Conversely, a point that signals unusual variation deserves investigation even if a simple annual average looks favorable. Nonrandom sequences can also signal a problem even when every point lies inside the limits.
Choose the chart to match the data
Counts, proportions, rates and continuous measurements have different statistical properties. The appropriate chart and its calculations depend on the data and the measurement design. A chart built for a fixed opportunity count may be inappropriate when the number of opportunities changes substantially.
Work with someone who understands the selected method. A familiar spreadsheet template does not establish that the assumptions fit the nursing process being measured. Keep the calculations and decision rules available for review.
An illustrative interpretation problem
Suppose a hospital plots the number of transfer records missing at least one required item each week. One week has twice as many incomplete records as the previous week, but also twice as many transfers. The count alone may make the situation look worse even if the proportion is unchanged.
This hypothetical example does not prescribe a particular chart. It shows why the team must define the question and denominator before interpreting a signal. The team may care about both the burden of missing information and the reliability of each transfer; those are different measures.
Investigate before changing the system
When a signal appears, check data quality, the measurement definition and relevant conditions. A revised electronic field can change what is recorded without changing the underlying care. A temporary staffing or equipment issue may affect a particular period. Neither explanation should be assumed without evidence.
Also avoid changing the process after every routine fluctuation. The purpose of SPC is partly to help distinguish ordinary variation from circumstances that deserve a different response.
Document why control limits are recalculated. Redrawing them whenever results become uncomfortable can hide the information the chart was intended to reveal. An analyst should help determine when a new process baseline is justified.
For a simpler introductory display, see run charts. For choosing what to measure, see quality improvement measures.
Alongside the process being charted, ask which balancing measures could reveal unintended effects.
Sources
- AHRQ — Statistical Process Control (accessed 2026-09-17).
- AHRQ PSNet — Tracking Improvements in Patient Safety (accessed 2026-09-17).
- NIST — What Are Control Charts? (accessed 2026-09-17).
- NIST — Variables Control Charts (accessed 2026-09-17).
- NIST — Counts Control Charts (accessed 2026-09-17).
- NIST — Types of Control Charts (accessed 2026-09-17).