
Equity in quality-improvement measurement asks whether care processes and outcomes differ across groups and whether a proposed change narrows, preserves, or widens those differences. An overall improvement can coexist with a worsening experience for some patients.
The task is to make those patterns visible without treating a group label as an explanation. Measurement should lead to questions about access, care design, resources, and data quality rather than assumptions about patients.
Start with a plausible difference in experience
Choose groupings relevant to the project and supported by responsibly collected data. A communication project may examine preferred language or need for assistance. A service-access project may need to consider geography or the method used to contact the service.
IHI's measurement guidance recommends disaggregating data to identify potential inequities. Its health-equity infrastructure guide emphasizes accurate collection, understanding missing data, and assessing whether recorded demographic information reflects patients' self-identification.
Explain why information is collected and use the organization's approved process. Do not infer a person's identity from appearance or fill an unknown category with a guess. Current legal and organizational requirements for collecting and reporting demographic information need separate review; this article does not prescribe a mandatory classification system.
Compare like with like
Use the same measure definition, period, eligibility rules, and exclusions for each group. Present group denominators as well as percentages. Small numbers can produce unstable-looking changes, while missing information can make a comparison misleading.
Describe the unknown or unrecorded category rather than silently dropping it. IHI notes that missing demographic data can bias summaries when missingness differs across groups or conditions. A completeness check is therefore part of interpreting the result, not a separate administrative detail.
Illustrative hidden gap
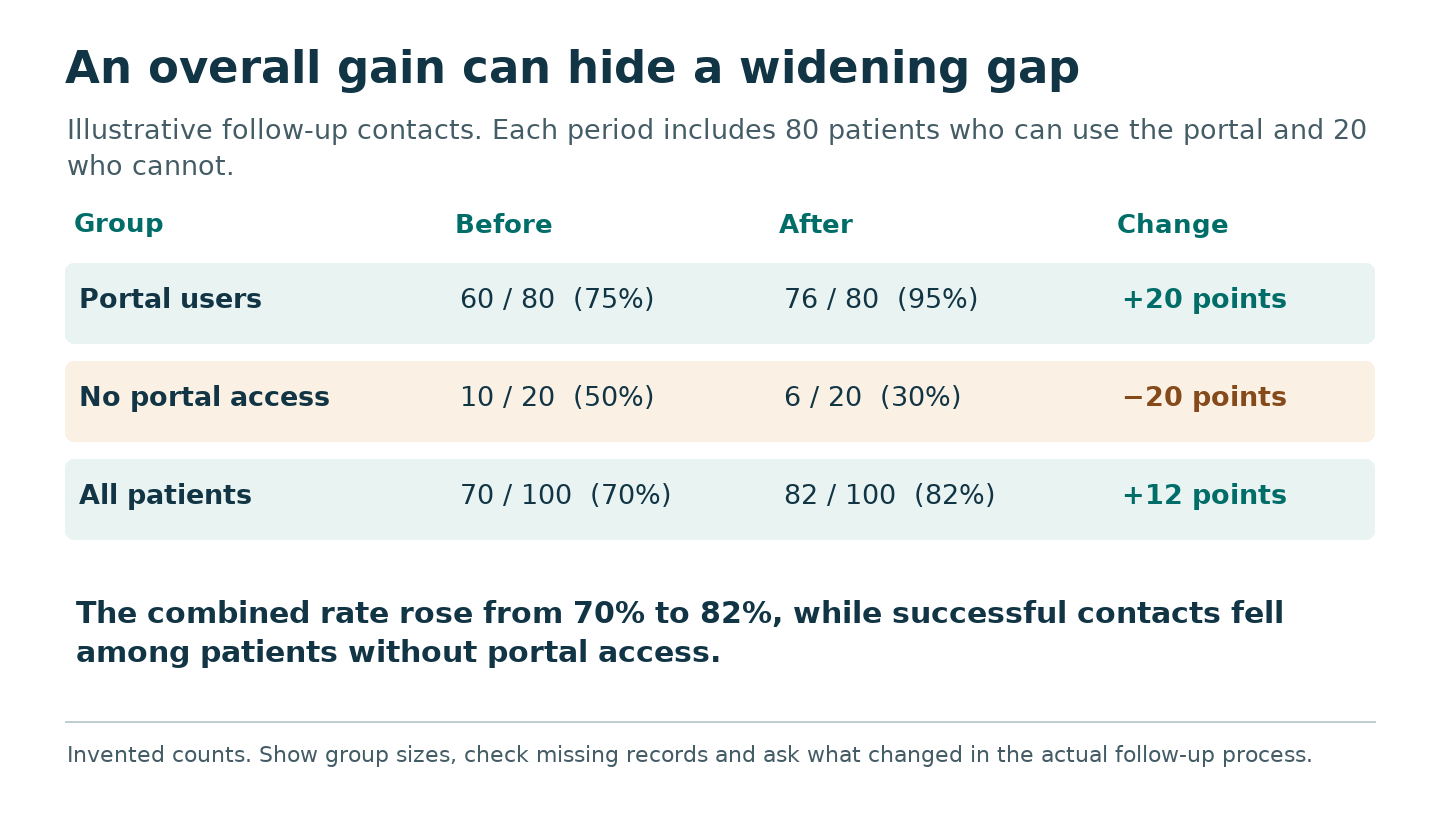
In an illustrative clinic project, the overall proportion of patients receiving a follow-up message rises. When the team separates results by communication channel, patients who cannot use the portal receive fewer completed contacts.
The team checks the definitions, missing records, and actual workflow before concluding why the difference occurred. It then considers an alternative contact process. This example contains no observed rates or claimed effects; it shows why a favorable average is not enough to establish equitable improvement.
Interpret with affected people
Ask patients and staff what might explain the pattern. Distinguish an observed difference from a demonstrated cause. A dashboard cannot by itself establish discrimination, patient preference, or the reason a process failed.
Protect privacy when presenting small groups. Follow the organization's disclosure and reporting rules and seek analytic advice when counts are too small for a meaningful public comparison. Combining categories may improve precision but can also conceal important differences, so document the trade-off.
Monitor the relevant groups over time as the process changes. The goal is not merely to add demographic columns to a report; it is to determine whether the improvement reaches the people who need it and to respond when it does not.
Before comparing rates across groups, check who was included and who may be missing.
Related
Selecting Quality Improvement Measures
Balancing Measures in Quality Improvement
Sources
-
IHI: Establishing Measures (accessed 2026-09-17).
-
IHI: Improving Health Equity — Build Infrastructure to Support Health Equity (accessed 2026-09-17).