
A driver diagram sets out a team's explanation of how its proposed changes might achieve an improvement aim. It connects the aim to broad contributing factors, more specific parts of those factors and ideas the team can test. The diagram is a theory to examine, not proof that each connection is causal.
What the diagram contains
The Institute for Healthcare Improvement describes four connected elements: the overall aim, primary drivers, secondary drivers and specific change ideas. A primary driver represents an important condition for achieving the result. A secondary driver describes a more specific contribution to that condition. A change idea is something the team could actually try.
Keep those levels distinct. “Effective communication” might identify a broad need; “add a phone number to a form” describes an action. Treating both as equivalent boxes makes it harder to see which problem the action is meant to solve.
An illustrative nursing project
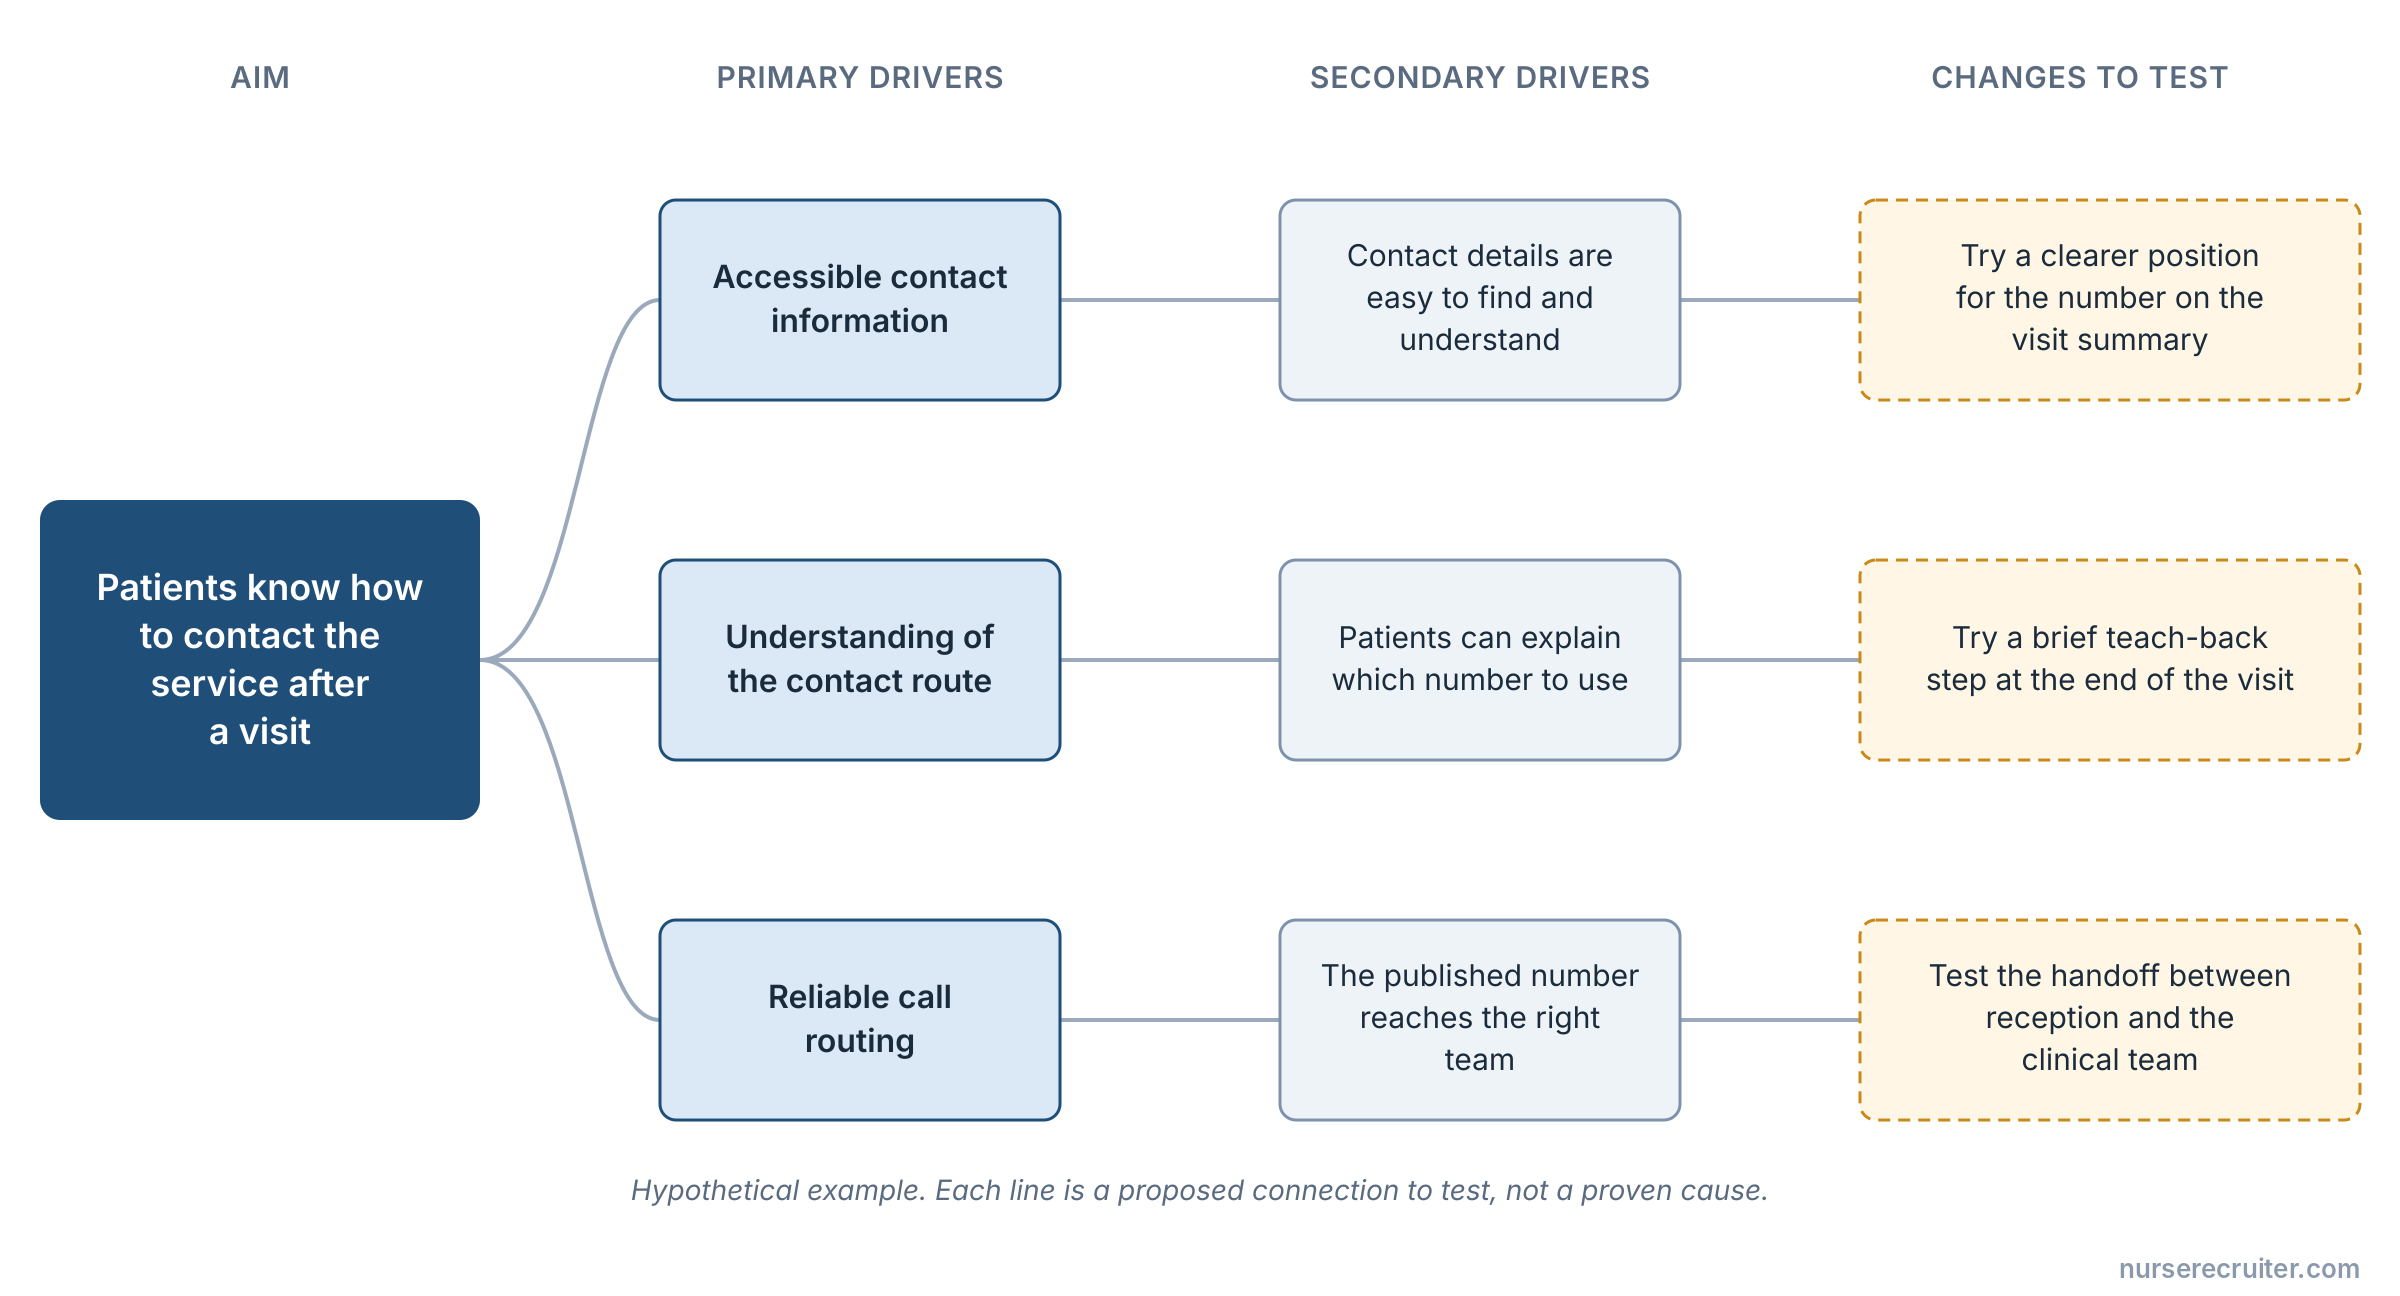
Suppose a team wants patients to leave an outpatient visit knowing how to contact the service with a question. It might propose accessible information as one driver and reliable routing of calls as another. Under accessible information, the team could consider language, reading level and the format in which contact details are provided.
A possible change idea is to test where contact details appear in an approved visit summary. Another is to try a brief teach-back step: ask the patient to explain which number to use, then clarify any misunderstanding. These are hypothetical proposals, not validated interventions. The diagram makes the reasoning visible so patients, nurses and other team members can challenge it.
If the telephone line is not staffed as described, a clearer handout alone will not achieve the aim. That is the kind of missing dependency a useful diagram should expose.
A compact version of this hypothetical driver diagram could look like this:
| Aim | Primary driver | Secondary driver | Change to test |
|---|---|---|---|
| Patients know how to contact the service after a visit | Accessible contact information | Contact details are easy to find and understand | Try a clearer position for the number in an approved visit summary |
| Same aim | Understanding of the contact route | Patients can explain which number to use | Try a brief teach-back step and record what needs clarification |
| Same aim | Reliable call routing | The published number reaches the appropriate team | Test the handoff between reception and the clinical team under agreed conditions |
The rows are proposed connections to test; they do not establish that any of these changes will improve a real service.
Use it to select a test
For each proposed action, ask what the team expects to change and what observation would support or weaken that expectation. The answer can inform a PDSA cycle.
Do not add every attractive idea to the diagram. A project can become a list of unrelated initiatives unless the team can explain how each one contributes to its aim. Conversely, do not remove an uncomfortable dependency merely because it belongs to another department.
Revise the theory as evidence arrives
During review, identify which connections rest on research, local observations, patient experience or an assumption that still needs testing. An arrow between boxes should not erase those differences.
Keep dated versions. If the team learns that information was available but arrived too late, the next version may need to emphasize timing. Recording that change preserves the learning and prevents a final diagram from suggesting the team understood the problem perfectly from the start.
For a picture of how work currently moves, use process mapping. A driver diagram answers a different question: how the team thinks improvement could happen.
When testing a change suggested by the diagram, identify a possible unwanted effect to measure.
Sources
- IHI — Driver Diagram (accessed 2026-09-17).
- IHI — Selecting Changes (accessed 2026-09-17).