
The median registered nurse wage was $46.90 an hour nationwide in May 2025. State medians ranged from $37.06 in Alabama and Mississippi to $67.44 in California—a gap of $30.38 an hour. NurseRecruiter’s Nursing Pay Atlas compares wages across states, employer industries and clinical specialties, alongside studies of inflation and local living costs.
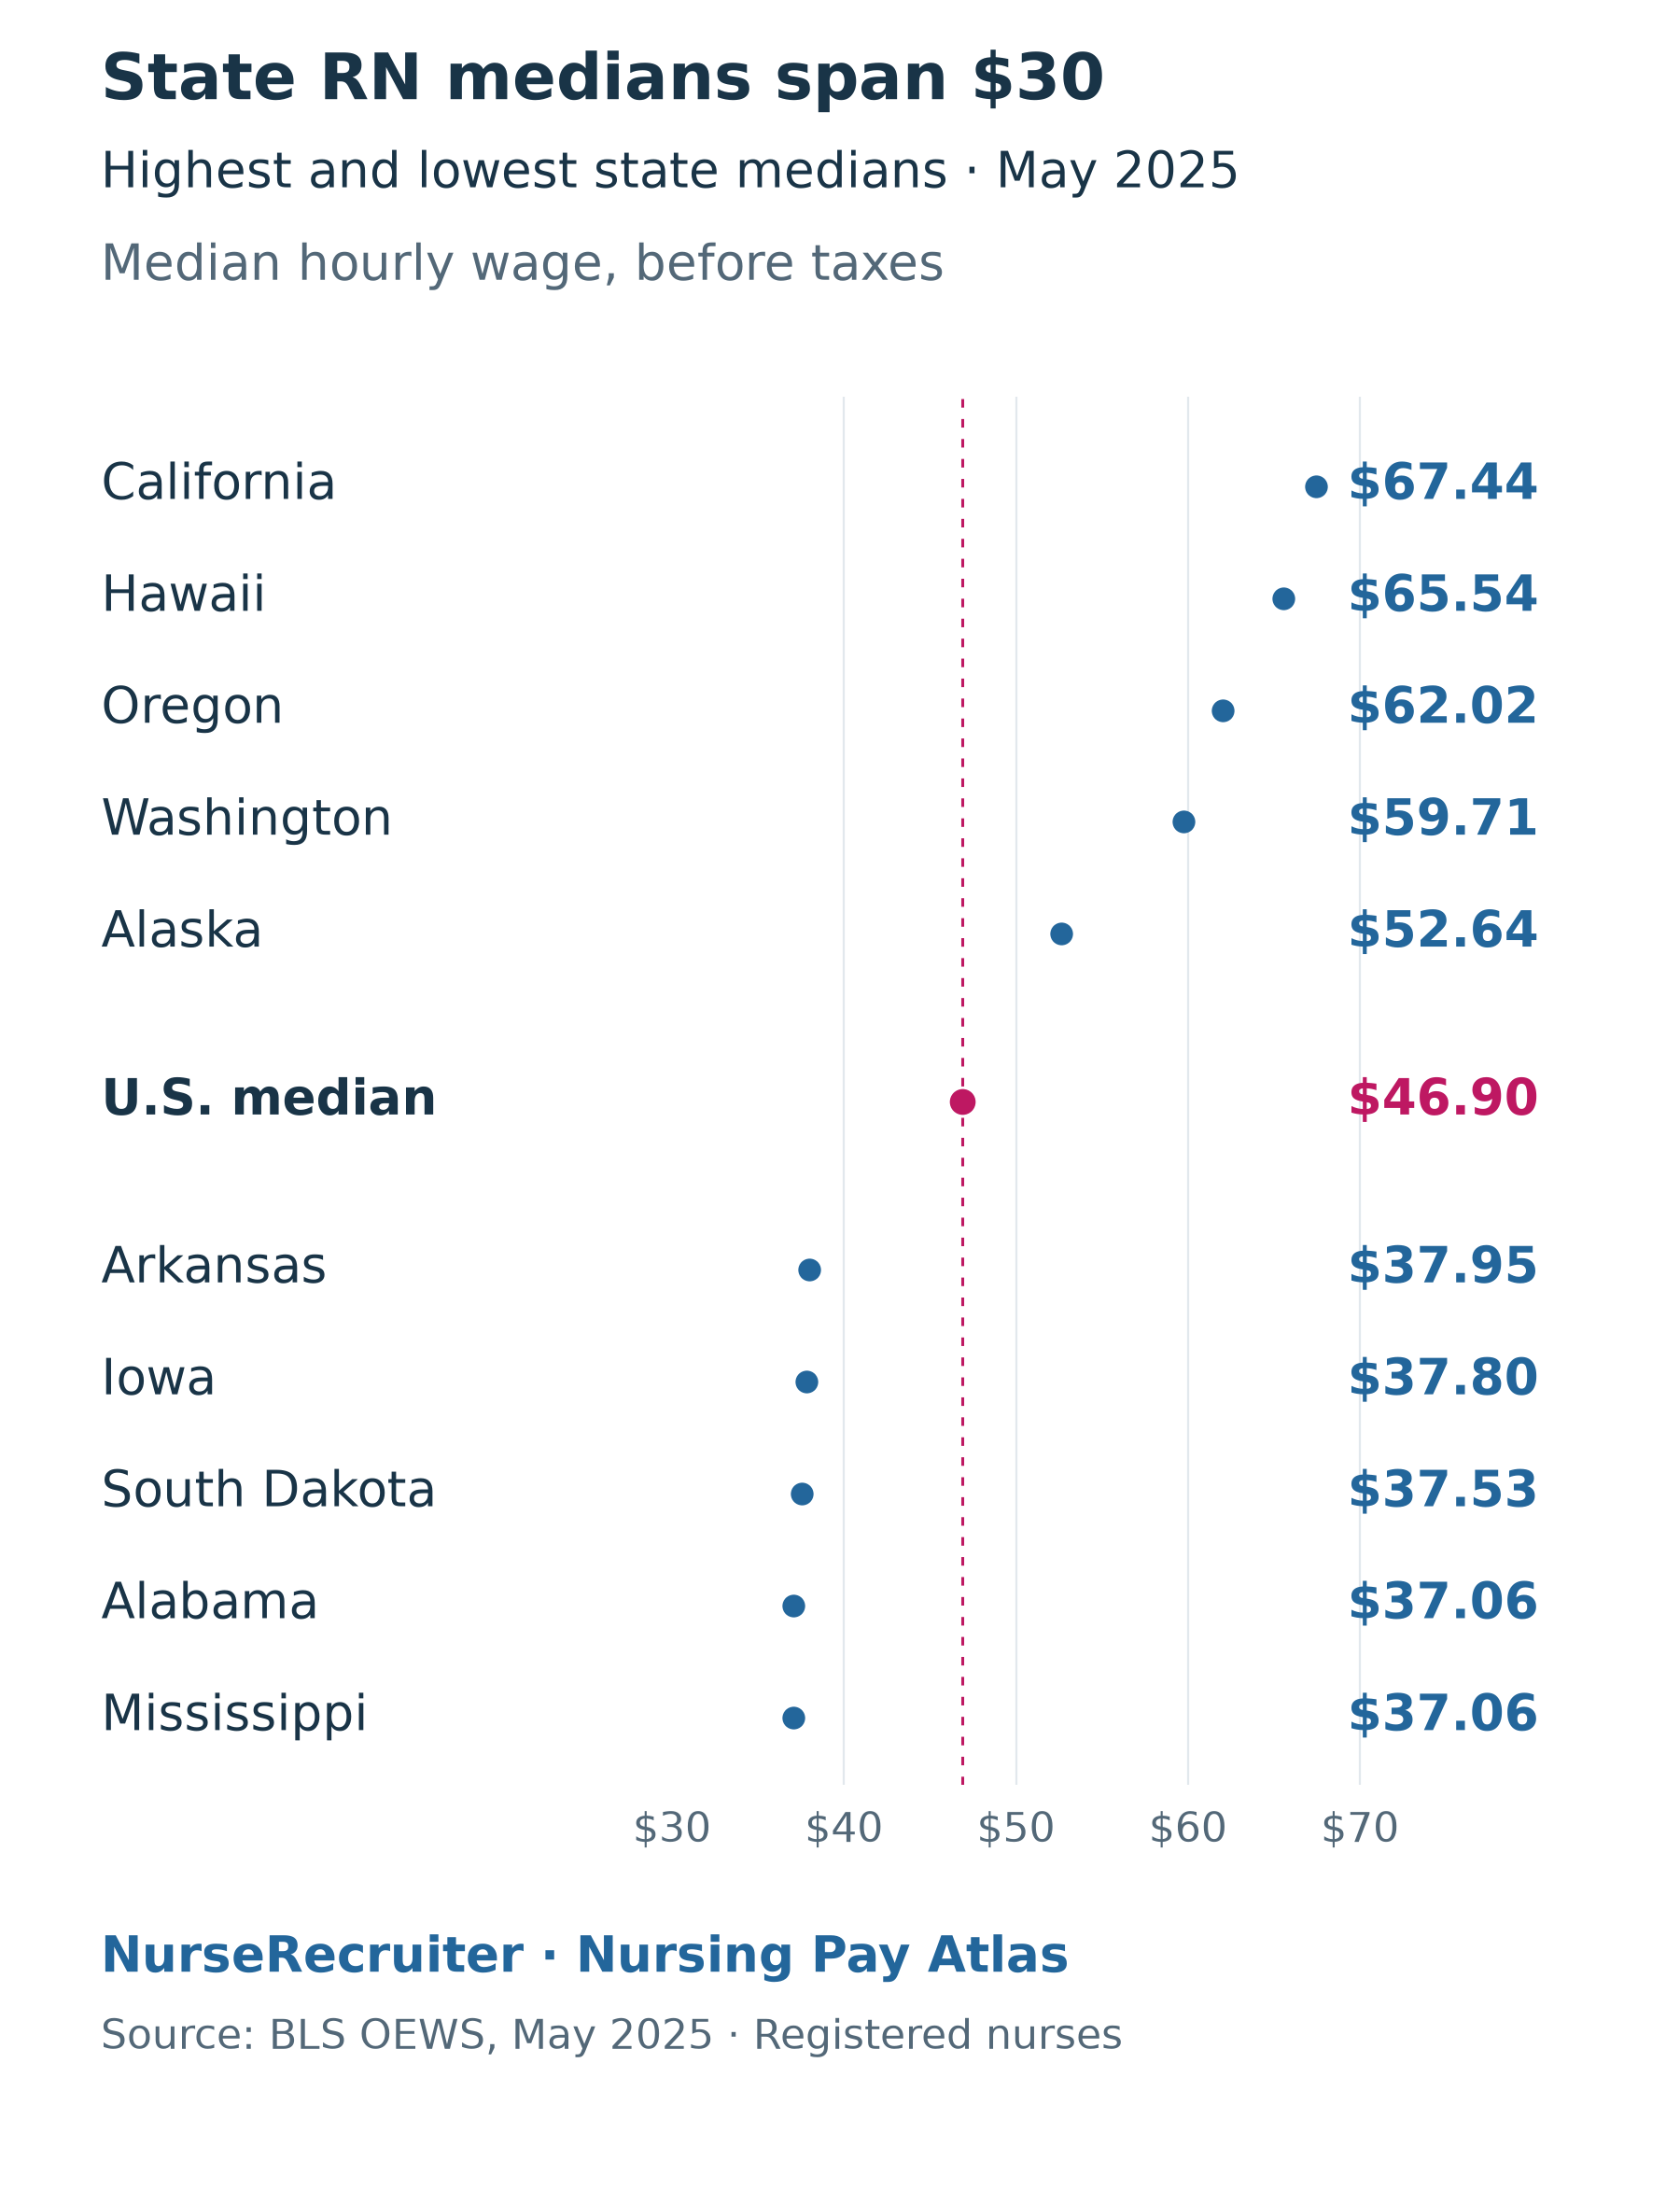
The five highest and five lowest state medians, compared with the national RN median. These wages are before taxes and are not adjusted for local prices.
State wages · Wage trends · Pay by industry · Specialty earnings · Living costs and taxes
National wage distribution
The May 2025 BLS estimates put the middle half of RN hourly wages between $38.62 and $54.02. The survey counted 3,379,720 RN employee jobs and put the mean annual wage at $101,420. The median annual wage was $97,550.
| Position in the RN wage distribution | Hourly wage | Annual wage |
|---|---|---|
| 10th percentile | $33.14 | $68,940 |
| 25th percentile | $38.62 | $80,330 |
| Median | $46.90 | $97,550 |
| 75th percentile | $54.02 | $112,350 |
| 90th percentile | $66.09 | $137,470 |
BLS annualizes RN hourly wages at 2,080 hours. These are gross employee wages, excluding overtime premiums, shift differentials and employer benefit costs; self-employed nurses are outside the survey. Annualized wages are benchmarks; actual earnings depend on paid hours and the terms of employment.
The May 2025 mean was the first above six figures. NurseRecruiter's report on the release noted that the mean RN wage rose 6.2%, 4.2% and 3.0% in the last three annual releases, while the mean for all occupations rose 2.7% in the latest year, from $67,920 to $69,770. The occupational handbook gives 3,465,400 RN jobs for 2025; it uses a broader employment measure than the wage survey's 3,379,720.
To reproduce a comparison or choose a different measure, use the nursing workforce datasets and downloads guide.
RN wages over time
High pay and rising pay are different findings. California still had the highest state median in May 2025, but its wage had fallen 1.0% after inflation since May 2023. Vermont’s median rose 12.6% after inflation, moving from 26th to 19th among the states and D.C.
Nationwide, the median rose 7.2% after inflation over those two years. Yet 16 states and D.C. lost ground. NurseRecruiter’s RN Wage Trends gives each state’s wage change and rank movement, plus national wage history back to 1997. The comparisons use national consumer-price inflation; the purchasing-power study instead measures price differences between places.
These are changes in published wage estimates, not raises received by the same nurses. The history separates periods affected by changes in occupational definitions and survey methods.
RN pay and employment by state
The table pairs the May 2025 median wage with filled RN employee jobs in all 50 states and D.C. State links lead to local markets and employers.
Higher wages often come with higher prices; wages adjusted for local prices shows how the order changes. A large nursing workforce also does not mean high pay. In the May 2024 data, South Dakota had more RN jobs per 1,000 jobs than any other state (32) and West Virginia the second most (31), as NurseRecruiter's 2025 state pay report noted; both remained among the lowest-paying states in May 2025. Practical and advanced practice nurses are separate occupations with their own state figures: see LPN/LVN pay, nurse practitioner pay and nurse anesthetist pay.
| State or district | RN employee jobs | Median hourly wage | Median annual wage |
|---|---|---|---|
| Alabama | 54,340 | $37.06 | $77,080 |
| Alaska | 7,510 | $52.64 | $109,480 |
| Arizona | 73,150 | $47.84 | $99,500 |
| Arkansas | 29,400 | $37.95 | $78,940 |
| California | 338,940 | $67.44 | $140,270 |
| Colorado | 54,490 | $48.20 | $100,260 |
| Connecticut | 40,110 | $49.39 | $102,740 |
| Delaware | 14,290 | $47.85 | $99,520 |
| District of Columbia | 11,440 | $49.30 | $102,540 |
| Florida | 229,940 | $40.48 | $84,190 |
| Georgia | 100,950 | $44.98 | $93,550 |
| Hawaii | 12,940 | $65.54 | $136,320 |
| Idaho | 16,880 | $44.45 | $92,460 |
| Illinois | 138,910 | $46.15 | $95,990 |
| Indiana | 68,980 | $40.14 | $83,500 |
| Iowa | 34,420 | $37.80 | $78,630 |
| Kansas | 33,800 | $38.14 | $79,320 |
| Kentucky | 50,300 | $38.96 | $81,040 |
| Louisiana | 48,970 | $38.57 | $80,230 |
| Maine | 16,540 | $41.82 | $86,990 |
| Maryland | 52,910 | $47.98 | $99,790 |
| Massachusetts | 88,200 | $50.27 | $104,550 |
| Michigan | 104,950 | $45.34 | $94,300 |
| Minnesota | 70,110 | $48.80 | $101,510 |
| Mississippi | 29,060 | $37.06 | $77,090 |
| Missouri | 76,310 | $39.32 | $81,780 |
| Montana | 10,950 | $41.00 | $85,280 |
| Nebraska | 24,720 | $40.74 | $84,730 |
| Nevada | 27,070 | $49.84 | $103,670 |
| New Hampshire | 15,390 | $47.93 | $99,700 |
| New Jersey | 92,680 | $51.20 | $106,500 |
| New Mexico | 17,980 | $45.36 | $94,340 |
| New York | 205,810 | $52.62 | $109,440 |
| North Carolina | 111,120 | $40.56 | $84,350 |
| North Dakota | 11,340 | $38.81 | $80,730 |
| Ohio | 143,730 | $39.67 | $82,510 |
| Oklahoma | 38,270 | $39.87 | $82,920 |
| Oregon | 39,730 | $62.02 | $129,010 |
| Pennsylvania | 146,520 | $46.36 | $96,430 |
| Rhode Island | 10,090 | $48.39 | $100,640 |
| South Carolina | 49,750 | $39.60 | $82,360 |
| South Dakota | 14,710 | $37.53 | $78,060 |
| Tennessee | 72,200 | $39.18 | $81,500 |
| Texas | 271,380 | $46.14 | $95,970 |
| Utah | 27,420 | $40.67 | $84,600 |
| Vermont | 7,410 | $46.86 | $97,460 |
| Virginia | 77,490 | $45.00 | $93,600 |
| Washington | 69,260 | $59.71 | $124,200 |
| West Virginia | 23,430 | $38.52 | $80,130 |
| Wisconsin | 68,060 | $45.93 | $95,530 |
| Wyoming | 5,330 | $40.27 | $83,760 |
Wage rank and travel advertising measure different things. California and Hawaii had the highest median RN wages, but in NurseRecruiter's analysis of archived travel postings from 2009 through September 2026 they ranked 22nd and 26th among the states and D.C. for postings per employed RN; Idaho, Alaska, New Mexico, Maine and Vermont ranked highest. The posting ranks describe advertising, not the pay of a travel contract. In the September 2026 NurseRecruiter Nurse Profile Study, about half of Hawaii RN profiles indicated willingness to travel; the profiles record interest, not whether a nurse moved or earned more.
Pay by industry
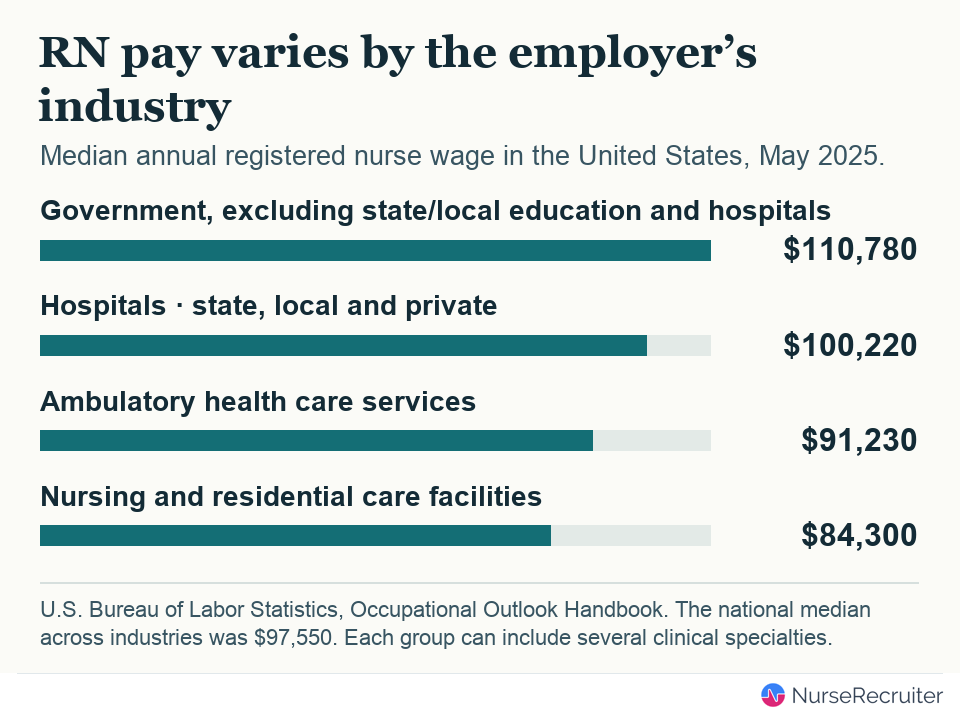
The employer’s industry distinguishes hospital, ambulatory and residential-care wages. Each row covers the RN occupation nationwide.
| U.S. employer industry | Median annual RN wage, May 2025 |
|---|---|
| Government, excluding state and local education and hospitals | $110,780 |
| State, local, and private hospitals | $100,220 |
| Ambulatory health care services | $91,230 |
| Nursing and residential care facilities | $84,300 |
The hospital median exceeded the nursing and residential care median by $15,920. An industry is the employer’s business, not the nurse’s specialty. Two oncology nurses working for a hospital and a separately operated outpatient practice can fall into different industries. For federal appointments with published steps, Veterans Affairs nursing shows how to identify a specific rate.
Earnings by clinical specialty
NurseRecruiter calculated these weighted estimates from HRSA’s 2022 National Sample Survey of Registered Nurses. They describe the primary nursing job held at the end of 2021. Across 14,512 full-time respondents licensed as RNs without an APRN license, mean primary-job earnings were $85,800. The table shows selected specialties using the same population, year and definition. Earnings include overtime and bonuses other than sign-on bonuses.
| Reported specialty | Survey respondents | Mean annual earnings | Approximate 95% confidence interval |
|---|---|---|---|
| General medical-surgical care | 1,544 | $84,100 | $81,300–$86,800 |
| Critical or intensive care | 1,163 | $91,900 | $89,300–$94,500 |
| Emergency or trauma care | 936 | $92,700 | $89,100–$96,300 |
| Oncology | 403 | $86,400 | $81,400–$91,400 |
| School health service, including K–12 and postsecondary settings | 442 | $58,100 | $54,300–$61,900 |
| Community or public health | 306 | $80,400 | $69,300–$91,400 |
| Rehabilitation | 318 | $82,000 | $77,200–$86,700 |
These are historical earnings, not current starting rates. Location, experience, shift pattern and hours can differ across groups. Some full-time respondents worked only part of the calendar year. Public-use earnings of $250,000 and above are recorded as $250,000. Means use the survey weights; the approximate 95% intervals use all 80 successive-difference replicate weights and reflect sampling uncertainty. A difference between two rows alone does not establish that moving specialties will change pay by that amount.
For an offer today, use the latest local wage distribution, then compare the position’s actual base rate, shift and call premiums, paid hours and benefits. Comparing RN pay offers works through those terms, and setting nurse pay covers the employer’s side.
Wages adjusted for local prices
In NurseRecruiter’s RN Purchasing Power study, Florida’s higher wage bought less than Arkansas’s. Their May 2024 median RN wages were $39.83 and $37.08 an hour; after adjusting for BEA’s 2024 regional prices, they were worth $38.52 and $42.65 at average U.S. prices. California still led at $60.94. These are gross purchasing-power estimates, before taxes.
Metro price comparisons
Houston’s median RN wage was slightly lower than Dallas–Fort Worth’s in May 2024, but bought more after accounting for local prices: $47.67 versus $46.05 an hour at average U.S. prices. The 2024 state and metro rankings give actual and adjusted pay together.
Rent relative to RN pay
California’s median two-bedroom rent was $366 a month higher than Florida’s in 2025, yet covering it took 33.2 hours of median RN pay rather than 46.3. NurseRecruiter’s Rent in RN Hours pairs Census rent estimates with May 2025 BLS wages. D.C. had the highest state-or-district result, 51.5 hours, up 4.5 hours from 2024.
The state figures cover occupied homes, including longstanding leases. The metro rankings use HUD’s FY 2025 recent-mover rent benchmark instead. Both include basic utilities and use gross pay.
Employee health insurance premiums
Kansas and Washington had the same estimated average employee contribution for family coverage in 2025: $8,222 a year. That cost took 215.6 hours of median RN pay in Kansas and 137.7 in Washington, in NurseRecruiter’s Health Insurance in RN Hours.
The study pairs AHRQ’s private-sector premium estimates across all occupations with May 2025 BLS RN wages. It measures the employee’s premium share, excluding employer contributions and out-of-pocket care costs; it does not measure nurses’ own plans or their quality.
Pay after modeled taxes
California’s annual median RN wage exceeded Texas’s by about $50,300 in 2024. In NurseRecruiter’s RN Pay After Taxes, that advantage narrowed to about $26,000 for a single 40-year-old filer with no dependents.
The study applies NBER’s TAXSIM test model to BLS annualized wages, subtracting federal and state income taxes plus employee Social Security and Medicare. It excludes local taxes, mandatory state payroll contributions and benefit deductions, so the result is not take-home pay.
These studies remain separate comparisons. Housing already contributes to the purchasing-power index; adding rent, insurance hours and tax rankings would double-count some costs and mix different years, populations and units.
Advanced practice occupations
BLS separates three advanced practice roles from the RN occupation. NurseRecruiter’s comparison uses the same May 2025 national survey:
| Occupation | Median hourly wage | Median annual wage |
|---|---|---|
| Nurse practitioner | $63.61 | $132,300 |
| Nurse-midwife | $64.44 | $134,040 |
| Nurse anesthetist | $113.75 | $236,590 |
The occupational handbook counts about 399,000 jobs across the three roles in 2025: 336,300 nurse practitioners, 54,500 nurse anesthetists and 8,200 nurse-midwives. It projects employment in the group to grow 36% from 2025 to 2035, compared with 6% for registered nurses; nurse practitioners account for most of that growth.
Clinical nurse specialists remain within the RN occupational estimates. These are different occupations with their own education, certification and practice requirements; the figures do not measure a pay increase for the same job after another degree.
From a benchmark to an offer
Published wage estimates exclude shift differentials, overtime premiums and employer benefit costs. Staff nurse pay steps and VA pay schedules identify contractual rates; travel contracts separate taxable wages from reimbursements. Employer-specific premiums, retirement contributions and repayment terms belong in the benefits comparison.
Citing this study
Credit comparisons and analysis to NurseRecruiter’s Nursing Pay Atlas and link to this article. Identify the period and measure used: the Atlas combines BLS wage estimates, HRSA survey findings and other dated sources. Credit the underlying publisher alongside NurseRecruiter’s analysis.
Related topics
- RN Wage Trends — Track inflation-adjusted wages and state rank changes.
- Registered Nurse Pay explains how to use these benchmarks to assess base pay, paid hours and employer ranges.
- Comparing two RN job offers — Work through paid hours, premiums and benefits for two offers.
- Staff nurse pay steps and experience credit — Find where prior experience places a nurse on a pay scale.
- BLS Occupational Employment and Wage Statistics — Check which earnings the published wage figures include.
- Nursing pay and cost-of-living datasets
Sources
- NurseRecruiter, RN Purchasing Power (accessed 2026-11-20). 2024 wages and regional prices.
- NurseRecruiter, Rent in RN Hours (accessed 2026-11-20). 2025 Census and HUD rents relative to RN wages; state changes from 2024.
- NurseRecruiter, Health Insurance in RN Hours (accessed 2026-11-20). 2025 employee family-plan contributions and RN wages.
- NurseRecruiter, RN Pay After Taxes (accessed 2026-11-20). 2024 BLS wages and NBER TAXSIM test-model results.
- NurseRecruiter, RN Wage Trends (accessed 2026-11-20). Inflation-adjusted national and state comparisons, including May 2023–May 2025.
- BLS, May 2025 Occupational Employment and Wage Statistics (accessed 2026-11-18). Registered nurses, occupation 29-1141, unless another occupation is named.
- BLS occupational profiles (accessed 2026-11-18). Select May 2025 and the occupation, geography and measure.
- BLS, Occupational Employment and Wages news release, May 2025 (accessed 2026-11-18). All-occupation mean annual wage of $69,770; RN mean and employment.
- BLS, Registered Nurses, industry medians (accessed 2026-11-18). Also 2025 employment of 3,465,400 and 2025–35 projection.
- BLS, Nurse Anesthetists, Nurse Midwives, and Nurse Practitioners (accessed 2026-11-18). 2025 jobs and 2025–35 projections.
- BLS, OEWS frequently asked questions (accessed 2026-11-18).
- HRSA, 2022 NSSRN public-use data (accessed 2026-11-18). Full-time primary-job workers without an APRN license; clinical specialty C28 and earnings C34. Weighted means and 80-replicate intervals.
- HRSA, 2022 NSSRN questionnaire (accessed 2026-11-18).
- HRSA, codebook and replicate-weight instructions (accessed 2026-11-18).
- BLS, May 2024 state wage tables (accessed 2026-11-18).
- BLS, May 2024 metro wage tables (accessed 2026-11-18).
- BLS, May 2024 national wage tables (accessed 2026-11-18).
- BEA, regional price parities (accessed 2026-11-18). 2024 all-items indexes. NurseRecruiter divided May 2024 hourly median wages by the corresponding index and multiplied by 100; source ZIP files were reread for this review.
- The average nurse now earns six figures, on the smallest raise in four years (accessed 2026-11-18). NurseRecruiter, May 26, 2026; annual changes in mean RN pay.
- The highest-paying states for nurses in 2025, and where your paycheck goes furthest (accessed 2026-11-18). NurseRecruiter, May 13, 2025; May 2024 BLS state means and RN jobs per 1,000 jobs in South Dakota and West Virginia.
- This is where nurse wages are highest — and where your RN salary is worth the most! (accessed 2026-11-18). NurseRecruiter, May 2024; 2023 BLS mean RN wages compared with BEA regional price parities.
- NurseRecruiter Travel Nursing Job Posting Study, September 2026 (accessed 2026-11-20).
- NurseRecruiter Nurse Profile Study, September 2026 (accessed 2026-11-20).