
The national median registered nurse wage rose 7.2% after inflation between May 2023 and May 2025, but the gains were uneven. NurseRecruiter’s RN Wage Trends analysis of federal wage estimates found that pay outpaced national inflation in 34 states. In the other 16 states and the District of Columbia, the median lost ground.
The national hourly median increased from $41.38 to $46.90. That was a 13.3% dollar increase against a 5.7% rise in consumer prices. These are changes in published wage estimates across employers, not the raises received by the same nurses. The state results also use national inflation; they do not measure each state’s cost of living.
Recent state comparison · 2012–2020 comparison · 2003–2011 comparison · National history
Where recent pay gains did—and did not—keep up
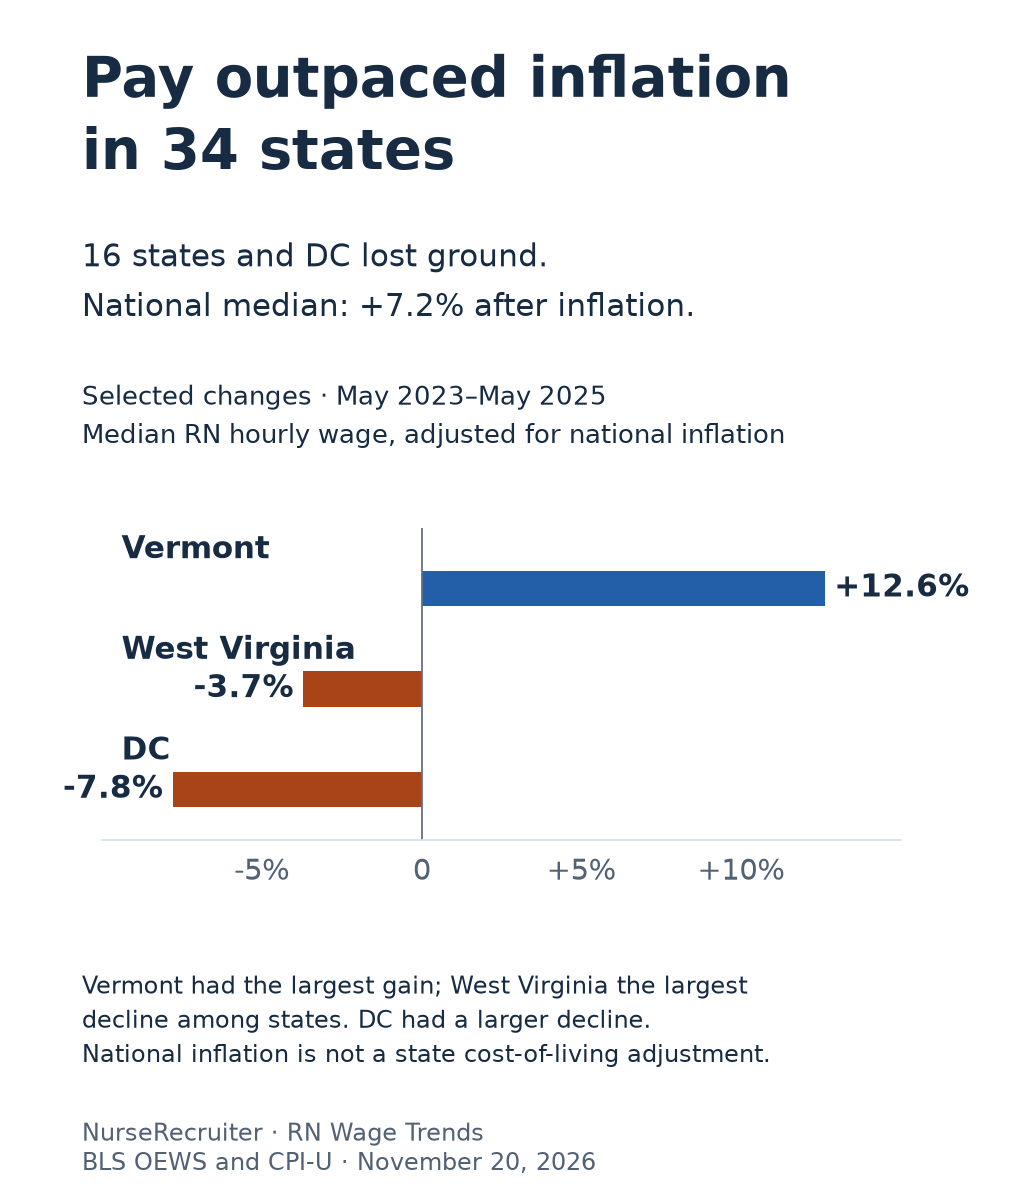
Vermont had the largest inflation-adjusted increase among the 50 states and DC: 12.6%. Its median moved from $39.37 to $46.86 an hour, lifting it from 26th to 19th in the wage ranking.
West Virginia’s median rose only from $37.85 to $38.52. Prices rose faster, leaving the wage 3.7% lower after inflation, the largest decline among states. Its wage rank fell from 37th to 45th. DC had a larger decline: its reported median fell from $50.59 to $49.30, or 7.8% after inflation. All comparisons in this section use May 2023 and May 2025.
California remained the highest-paying state, at $67.44 an hour in 2025. Its increase from $64.42 was smaller than national inflation, leaving the benchmark 1.0% lower in constant dollars.
The supporting observations are retained in the 2023 BLS archive and 2025 BLS archive.
The longer history needs separate periods
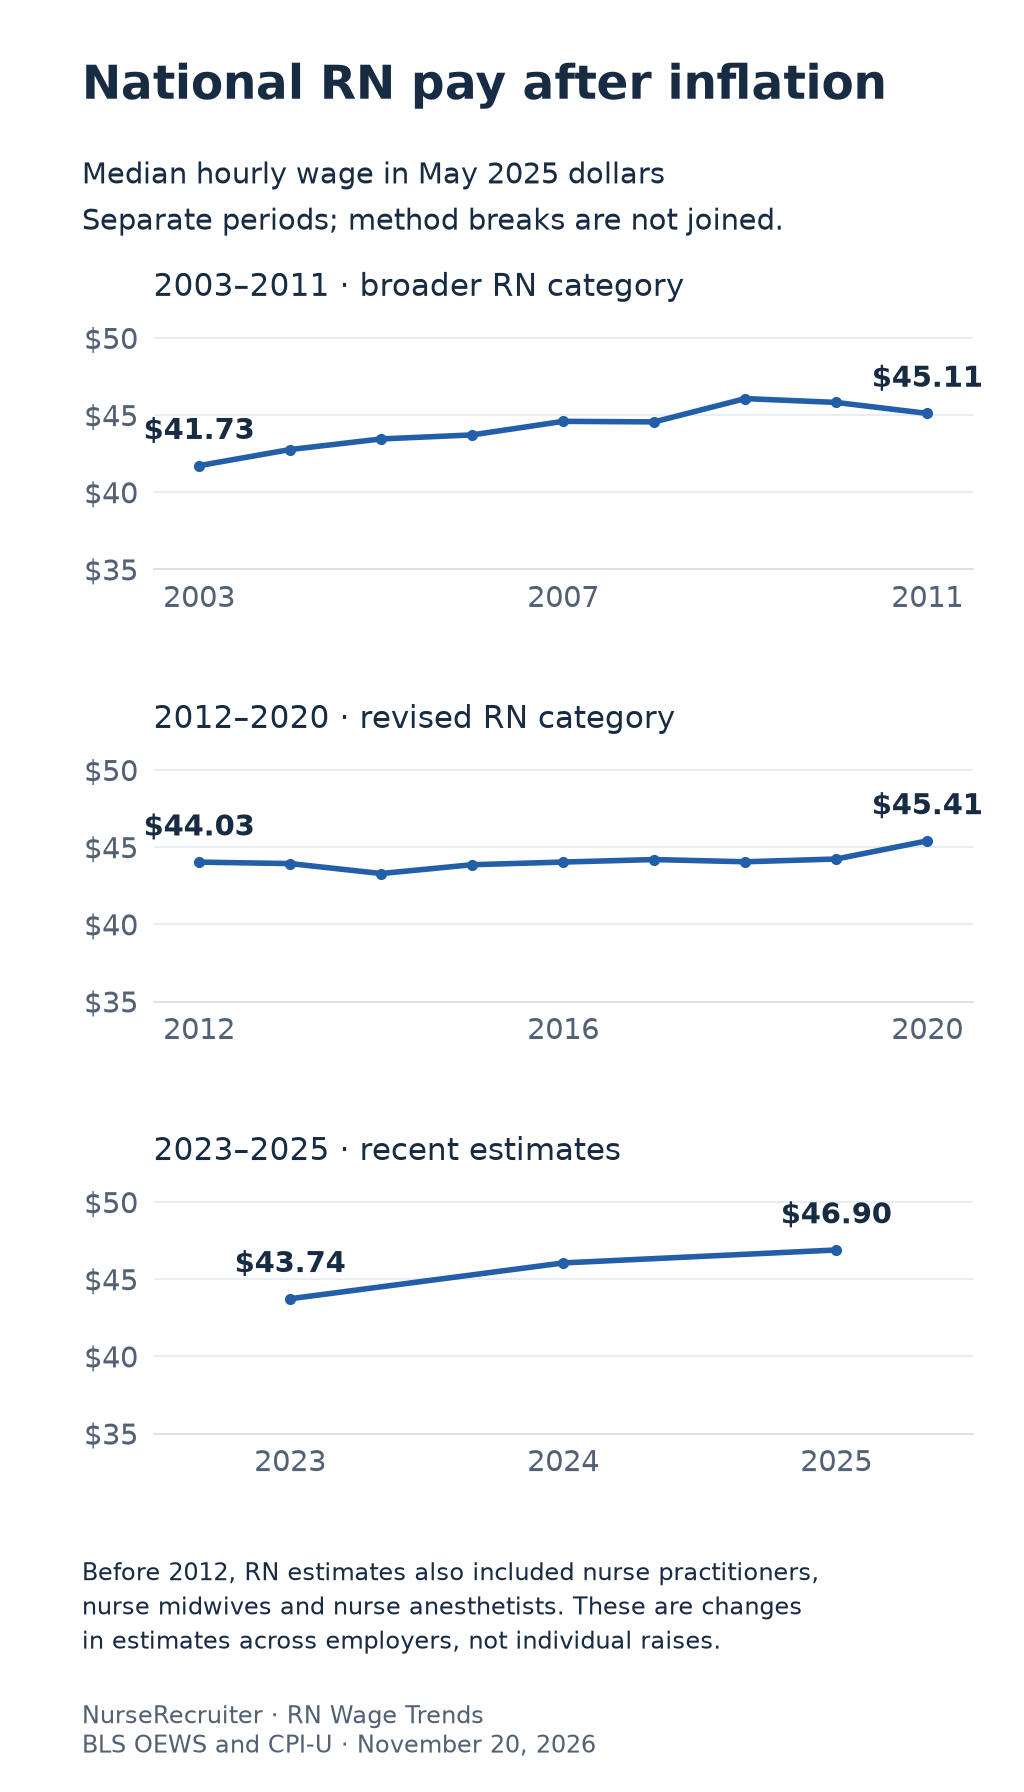
The panels share a dollar scale but cover different durations. Their slopes should not be read as comparable annual growth rates.
From May 2012 to May 2020, the national median rose from $31.48 to $36.22. Consumer prices absorbed most of the 15.1% dollar increase: the gain after inflation was 3.1%. Median wages outpaced national prices in 42 states and DC, while eight states lost ground. California and Hawaii had the largest inflation-adjusted increases, 16.3% and 16.2%, respectively. Delaware had the largest decline, 7.6%.
An earlier comparison, May 2003 to May 2011, shows a national median increase from $23.82 to $31.71, or 8.1% after inflation. That earlier RN category also included nurse practitioners, nurse midwives and nurse anesthetists. BLS separated those three occupations in 2012. Clinical nurse specialists remain in the RN estimates. The two periods therefore describe different occupational populations.
The archived national observations extend to 1997, and every state plus DC has a usable median from 1998 onward. The earliest observations provide historical context. They do not support joining every edition into one uninterrupted growth rate. BLS changed classifications, collection and estimation over the period; its estimates also combine survey responses collected across several years.
The recent state wage gap narrowed
California’s wage was 2.03 times Alabama’s in 2023. In 2025, it was 1.82 times the $37.06 median shared by Alabama and Mississippi. The gap between the highest and lowest state medians narrowed from $34.61 to $30.38 an hour in May 2025 dollars.
A separate earlier comparison shows a widening gap. In 2012, California’s $43.88 median was 1.81 times South Dakota’s $24.24, the lowest state median. By 2020, California’s $56.93 was 2.02 times Alabama’s $28.19, then the lowest. In May 2025 dollars, that gap widened from $27.47 to $36.03 an hour. The 2021–2022 method changes prevent treating these two periods as one continuous account of when the direction changed.
These comparisons describe the extremes of the state wage distribution, not differences between individual nurses or local living costs.
Moving up a wage ranking is a separate finding
Nebraska climbed nine places, from 40th to 31st, between 2023 and 2025, although its inflation-adjusted gain was 2.6%. Vermont’s larger 12.6% gain moved it up seven places.
The longer 2012–2020 comparison shows North Dakota rising from 48th to 31st, with a 15.8% inflation-adjusted increase. Its median remained below the national median at the end of that period. Ranks place each observation among the same 50 states and DC; equal published medians share a rank. Small differences and changes in rank are not evidence of statistical significance.
State comparisons
Each table includes all 50 states and DC in alphabetical order. Wages are median gross hourly dollars. The change column adjusts for national CPI-U inflation between the two May observations. Ranks order the same 51 jurisdictions by wage, highest first; equal published wages share a competition rank (1, 1, 3). National inflation adjustment does not change the within-year wage ranks.
State comparison 2023 to 2025
Original wage estimates: May 2023 and May 2025.
| State or DC | May 2023, $/hour | May 2025, $/hour | Change after inflation | 2023 wage rank | 2025 wage rank |
|---|---|---|---|---|---|
| Alabama | $31.68 | $37.06 | +10.7% | 51 | 50 |
| Alaska | $51.16 | $52.64 | -2.7% | 5 | 5 |
| Arizona | $42.46 | $47.84 | +6.6% | 16 | 18 |
| Arkansas | $35.06 | $37.95 | +2.4% | 47 | 47 |
| California | $64.42 | $67.44 | -1.0% | 1 | 1 |
| Colorado | $41.78 | $48.20 | +9.1% | 17 | 14 |
| Connecticut | $48.37 | $49.39 | -3.4% | 8 | 10 |
| Delaware | $44.81 | $47.85 | +1.0% | 14 | 17 |
| District of Columbia | $50.59 | $49.30 | -7.8% | 6 | 11 |
| Florida | $38.92 | $40.48 | -1.6% | 29 | 34 |
| Georgia | $40.20 | $44.98 | +5.9% | 22 | 27 |
| Hawaii | $62.12 | $65.54 | -0.2% | 2 | 2 |
| Idaho | $38.53 | $44.45 | +9.1% | 30 | 28 |
| Illinois | $39.65 | $46.15 | +10.1% | 25 | 21 |
| Indiana | $37.76 | $40.14 | +0.6% | 38 | 36 |
| Iowa | $34.41 | $37.80 | +3.9% | 48 | 48 |
| Kansas | $36.43 | $38.14 | -1.0% | 45 | 46 |
| Kentucky | $37.42 | $38.96 | -1.5% | 41 | 42 |
| Louisiana | $36.85 | $38.57 | -1.0% | 43 | 44 |
| Maine | $39.24 | $41.82 | +0.8% | 28 | 29 |
| Maryland | $42.95 | $47.98 | +5.7% | 15 | 15 |
| Massachusetts | $47.95 | $50.27 | -0.8% | 10 | 8 |
| Michigan | $39.28 | $45.34 | +9.2% | 27 | 25 |
| Minnesota | $46.78 | $48.80 | -1.3% | 11 | 12 |
| Mississippi | $33.35 | $37.06 | +5.1% | 49 | 50 |
| Missouri | $37.11 | $39.32 | +0.2% | 42 | 40 |
| Montana | $38.06 | $41.00 | +1.9% | 35 | 30 |
| Nebraska | $37.55 | $40.74 | +2.6% | 40 | 31 |
| Nevada | $46.25 | $49.84 | +2.0% | 12 | 9 |
| New Hampshire | $41.65 | $47.93 | +8.9% | 18 | 16 |
| New Jersey | $48.15 | $51.20 | +0.6% | 9 | 7 |
| New Mexico | $40.37 | $45.36 | +6.3% | 21 | 24 |
| New York | $50.28 | $52.62 | -1.0% | 7 | 6 |
| North Carolina | $38.26 | $40.56 | +0.3% | 34 | 33 |
| North Dakota | $36.03 | $38.81 | +1.9% | 46 | 43 |
| Ohio | $38.44 | $39.67 | -2.4% | 32 | 38 |
| Oklahoma | $37.87 | $39.87 | -0.4% | 36 | 37 |
| Oregon | $53.34 | $62.02 | +10.0% | 3 | 3 |
| Pennsylvania | $39.80 | $46.36 | +10.2% | 24 | 20 |
| Rhode Island | $45.60 | $48.39 | +0.4% | 13 | 13 |
| South Carolina | $37.68 | $39.60 | -0.6% | 39 | 39 |
| South Dakota | $32.23 | $37.53 | +10.2% | 50 | 49 |
| Tennessee | $36.64 | $39.18 | +1.2% | 44 | 41 |
| Texas | $40.92 | $46.14 | +6.7% | 19 | 22 |
| Utah | $38.36 | $40.67 | +0.3% | 33 | 32 |
| Vermont | $39.37 | $46.86 | +12.6% | 26 | 19 |
| Virginia | $40.43 | $45.00 | +5.3% | 20 | 26 |
| Washington | $51.79 | $59.71 | +9.1% | 4 | 4 |
| West Virginia | $37.85 | $38.52 | -3.7% | 37 | 45 |
| Wisconsin | $40.05 | $45.93 | +8.5% | 23 | 23 |
| Wyoming | $38.45 | $40.27 | -0.9% | 31 | 35 |
State comparison 2012 to 2020
Original wage estimates: May 2012 and May 2020.
| State or DC | May 2012, $/hour | May 2020, $/hour | Change after inflation | 2012 wage rank | 2020 wage rank |
|---|---|---|---|---|---|
| Alabama | $26.02 | $28.19 | -2.9% | 47 | 51 |
| Alaska | $38.73 | $45.23 | +4.7% | 3 | 4 |
| Arizona | $34.24 | $37.98 | -0.6% | 13 | 15 |
| Arkansas | $26.16 | $29.97 | +2.7% | 46 | 46 |
| California | $43.88 | $56.93 | +16.3% | 1 | 1 |
| Colorado | $32.22 | $36.78 | +2.3% | 17 | 16 |
| Connecticut | $35.86 | $39.80 | -0.5% | 9 | 12 |
| Delaware | $33.62 | $34.67 | -7.6% | 16 | 25 |
| District of Columbia | $36.31 | $43.00 | +6.1% | 8 | 8 |
| Florida | $28.88 | $32.46 | +0.7% | 28 | 35 |
| Georgia | $29.42 | $33.48 | +2.0% | 26 | 29 |
| Hawaii | $40.96 | $53.08 | +16.2% | 2 | 2 |
| Idaho | $28.01 | $34.27 | +9.7% | 34 | 26 |
| Illinois | $31.34 | $34.91 | -0.2% | 20 | 23 |
| Indiana | $27.22 | $31.25 | +2.9% | 38 | 41 |
| Iowa | $24.85 | $29.39 | +6.0% | 50 | 48 |
| Kansas | $26.64 | $30.07 | +1.2% | 42 | 45 |
| Kentucky | $27.20 | $30.32 | -0.1% | 39 | 44 |
| Louisiana | $28.73 | $31.85 | -0.6% | 31 | 38 |
| Maine | $28.75 | $33.42 | +4.2% | 30 | 30 |
| Maryland | $33.80 | $38.37 | +1.8% | 15 | 13 |
| Massachusetts | $38.23 | $43.41 | +1.8% | 4 | 5 |
| Michigan | $30.69 | $35.11 | +2.5% | 21 | 21 |
| Minnesota | $33.96 | $38.24 | +0.9% | 14 | 14 |
| Mississippi | $26.53 | $28.77 | -2.8% | 44 | 50 |
| Missouri | $26.68 | $30.88 | +3.7% | 41 | 42 |
| Montana | $27.99 | $33.05 | +5.8% | 35 | 32 |
| Nebraska | $26.54 | $32.70 | +10.4% | 43 | 33 |
| Nevada | $37.33 | $42.29 | +1.5% | 6 | 9 |
| New Hampshire | $29.89 | $35.98 | +7.9% | 25 | 19 |
| New Jersey | $36.49 | $40.86 | +0.4% | 7 | 10 |
| New Mexico | $31.72 | $36.23 | +2.4% | 18 | 17 |
| New York | $35.16 | $43.19 | +10.1% | 11 | 6 |
| North Carolina | $27.88 | $32.13 | +3.3% | 36 | 37 |
| North Dakota | $25.61 | $33.08 | +15.8% | 48 | 31 |
| Ohio | $28.85 | $32.49 | +0.9% | 29 | 34 |
| Oklahoma | $26.78 | $31.58 | +5.7% | 40 | 40 |
| Oregon | $37.90 | $46.54 | +10.1% | 5 | 3 |
| Pennsylvania | $30.57 | $35.08 | +2.9% | 22 | 22 |
| Rhode Island | $35.06 | $39.93 | +2.1% | 12 | 11 |
| South Carolina | $27.76 | $31.75 | +2.5% | 37 | 39 |
| South Dakota | $24.24 | $28.84 | +6.6% | 51 | 49 |
| Tennessee | $26.49 | $29.91 | +1.2% | 45 | 47 |
| Texas | $31.60 | $36.21 | +2.7% | 19 | 18 |
| Utah | $28.22 | $32.30 | +2.6% | 33 | 36 |
| Vermont | $29.36 | $33.50 | +2.3% | 27 | 28 |
| Virginia | $30.11 | $34.82 | +3.7% | 24 | 24 |
| Washington | $35.72 | $43.10 | +8.2% | 10 | 7 |
| West Virginia | $25.51 | $30.37 | +6.7% | 49 | 43 |
| Wisconsin | $30.28 | $35.35 | +4.6% | 23 | 20 |
| Wyoming | $28.67 | $33.87 | +5.9% | 32 | 27 |
State comparison 2003 to 2011
The earlier RN category included nurse practitioners, nurse midwives and nurse anesthetists. Do not join these changes to the later periods.
Original wage estimates: May 2003 and May 2011.
| State or DC | May 2003, $/hour | May 2011, $/hour | Change after inflation | 2003 wage rank | 2011 wage rank |
|---|---|---|---|---|---|
| Alabama | $20.81 | $26.41 | +3.1% | 40 | 46 |
| Alaska | $26.47 | $38.67 | +18.6% | 11 | 4 |
| Arizona | $23.88 | $34.42 | +17.1% | 17 | 15 |
| Arkansas | $19.98 | $25.90 | +5.3% | 47 | 47 |
| California | $29.47 | $42.51 | +17.1% | 2 | 1 |
| Colorado | $23.88 | $32.35 | +10.0% | 17 | 17 |
| Connecticut | $26.58 | $35.60 | +8.8% | 10 | 8 |
| Delaware | $26.61 | $33.69 | +2.8% | 9 | 16 |
| District of Columbia | $26.98 | $35.25 | +6.1% | 6 | 11 |
| Florida | $22.20 | $29.44 | +7.7% | 31 | 28 |
| Georgia | $22.39 | $29.68 | +7.6% | 28 | 27 |
| Hawaii | $28.38 | $40.40 | +15.6% | 3 | 2 |
| Idaho | $21.75 | $28.24 | +5.4% | 34 | 34 |
| Illinois | $22.81 | $31.54 | +12.3% | 23 | 18 |
| Indiana | $20.98 | $27.42 | +6.1% | 39 | 38 |
| Iowa | $19.37 | $24.69 | +3.5% | 50 | 50 |
| Kansas | $20.02 | $26.75 | +8.5% | 46 | 43 |
| Kentucky | $21.03 | $27.35 | +5.6% | 38 | 39 |
| Louisiana | $21.75 | $29.27 | +9.3% | 34 | 29 |
| Maine | $22.40 | $28.98 | +5.1% | 27 | 30 |
| Maryland | $30.48 | $35.00 | -6.7% | 1 | 12 |
| Massachusetts | $27.13 | $39.63 | +18.6% | 4 | 3 |
| Michigan | $24.01 | $30.72 | +3.9% | 16 | 22 |
| Minnesota | $25.71 | $34.77 | +9.8% | 13 | 13 |
| Mississippi | $20.22 | $26.89 | +8.0% | 44 | 42 |
| Missouri | $21.23 | $27.03 | +3.4% | 37 | 40 |
| Montana | $19.83 | $27.86 | +14.1% | 48 | 37 |
| Nebraska | $20.58 | $26.61 | +5.0% | 41 | 44 |
| Nevada | $26.92 | $37.29 | +12.5% | 7 | 6 |
| New Hampshire | $22.00 | $30.17 | +11.4% | 32 | 26 |
| New Jersey | $26.76 | $36.31 | +10.2% | 8 | 7 |
| New Mexico | $22.96 | $31.48 | +11.3% | 21 | 20 |
| New York | $26.99 | $35.38 | +6.5% | 5 | 10 |
| North Carolina | $22.46 | $27.99 | +1.2% | 26 | 36 |
| North Dakota | $20.35 | $25.77 | +2.8% | 43 | 48 |
| Ohio | $22.53 | $28.74 | +3.6% | 25 | 31 |
| Oklahoma | $20.22 | $26.52 | +6.5% | 44 | 45 |
| Oregon | $25.35 | $37.35 | +19.6% | 15 | 5 |
| Pennsylvania | $23.34 | $30.78 | +7.1% | 19 | 21 |
| Rhode Island | $25.46 | $34.49 | +10.0% | 14 | 14 |
| South Carolina | $22.33 | $28.02 | +1.9% | 30 | 35 |
| South Dakota | $19.21 | $24.57 | +3.9% | 51 | 51 |
| Tennessee | $21.70 | $26.92 | +0.7% | 36 | 41 |
| Texas | $22.82 | $31.54 | +12.2% | 22 | 18 |
| Utah | $22.65 | $28.57 | +2.4% | 24 | 32 |
| Vermont | $21.76 | $30.41 | +13.5% | 33 | 24 |
| Virginia | $22.36 | $30.63 | +11.2% | 29 | 23 |
| Washington | $26.46 | $35.56 | +9.1% | 12 | 9 |
| West Virginia | $19.80 | $25.66 | +5.2% | 49 | 49 |
| Wisconsin | $23.22 | $30.22 | +5.7% | 20 | 25 |
| Wyoming | $20.56 | $28.50 | +12.6% | 42 | 33 |
National wage history
These are historical snapshots, not a continuous measure of raises. The source-year links also provide the original state estimates from 1998 onward. The comparison periods above avoid the principal occupational and estimation breaks. Fourth-quarter CPI is used for 1997–2001; later observations use the stated month.
| Reference period and source | Median hourly wage | In May 2025 dollars | Comparison context |
|---|---|---|---|
| Q4 1997 | $18.88 | $37.59 | 1997–1998: historical snapshots |
| Q4 1998 | $19.56 | $38.35 | 1997–1998: historical snapshots |
| Q4 1999 | $20.33 | $38.84 | 1999–2001: historical snapshots |
| Q4 2000 | $21.56 | $39.82 | 1999–2001: historical snapshots |
| Q4 2001 | $22.44 | $40.69 | 1999–2001: historical snapshots |
| November 2002 | $23.12 | $40.99 | 2002–2011: broader RN occupation |
| May 2003 | $23.82 | $41.73 | 2002–2011: broader RN occupation |
| May 2004 | $25.16 | $42.77 | 2002–2011: broader RN occupation |
| May 2005 | $26.28 | $43.46 | 2002–2011: broader RN occupation |
| May 2006 | $27.54 | $43.72 | 2002–2011: broader RN occupation |
| May 2007 | $28.85 | $44.60 | 2002–2011: broader RN occupation |
| May 2008 | $30.03 | $44.56 | 2002–2011: broader RN occupation |
| May 2009 | $30.65 | $46.07 | 2002–2011: broader RN occupation |
| May 2010 | $31.10 | $45.82 | 2002–2011: broader RN occupation |
| May 2011 | $31.71 | $45.11 | 2002–2011: broader RN occupation |
| May 2012 | $31.48 | $44.03 | 2012–2020: revised RN occupation |
| May 2013 | $31.84 | $43.94 | 2012–2020: revised RN occupation |
| May 2014 | $32.04 | $43.29 | 2012–2020: revised RN occupation |
| May 2015 | $32.45 | $43.87 | 2012–2020: revised RN occupation |
| May 2016 | $32.91 | $44.04 | 2012–2020: revised RN occupation |
| May 2017 | $33.65 | $44.20 | 2012–2020: revised RN occupation |
| May 2018 | $34.48 | $44.06 | 2012–2020: revised RN occupation |
| May 2019 | $35.24 | $44.24 | 2012–2020: revised RN occupation |
| May 2020 | $36.22 | $45.41 | 2012–2020: revised RN occupation |
| May 2021 | $37.31 | $44.55 | 2021–2022: method transition |
| May 2022 | $39.05 | $42.95 | 2021–2022: method transition |
| May 2023 | $41.38 | $43.74 | 2023–2025: recent estimates |
| May 2024 | $45.00 | $46.06 | 2023–2025: recent estimates |
| May 2025 | $46.90 | $46.90 | 2023–2025: recent estimates |
Evidence and comparison limits
NurseRecruiter combined the original BLS Occupational Employment and Wage Statistics releases with the BLS Consumer Price Index for All Urban Consumers, U.S. city average, all items, not seasonally adjusted. The wage measure is the median hourly RN wage. NurseRecruiter’s May 2025 wage-release report covers the separate milestone in mean annual pay; this study follows medians. National medians come from national estimates, not an average of state medians. Wages exclude overtime premiums, shift differentials and employer benefits.
Each price adjustment matches the wage reference period. The 1997–2001 observations use fourth-quarter average CPI as a quarter-matched approximation; 2002 uses November; the selected annual observations from 2003 onward use May. The separate November 2003 and November 2004 releases remain in the evidence but are not substituted for May in the annual comparisons. Historical dollar equivalents use May 2025 prices. Constant-dollar wages equal the published wage multiplied by May 2025 CPI divided by reference-period CPI. Real percentage changes use the ratio of endpoint wages divided by the ratio of endpoint CPI values, minus one, multiplied by 100. Results are calculated before rounding.
The charts and comparisons separate the 2012 occupation change and the 2021–2022 estimation transition. BLS introduced model-based estimation in 2021 and changed wage-rate processing in 2022. The recent comparison starts in 2023 because all six survey panels then fell after the threshold for the newer wage-rate processing. This is NurseRecruiter’s choice to reduce a known inconsistency, not a BLS guarantee that the estimates form a time series. Overlapping samples, workforce composition and sampling uncertainty still affect interpretation. BLS cautions against using OEWS as a time series.
The national chronology preserves each selected published median and marks the comparison periods; the linked yearly archives contain the original state estimates. The 1997 state source was unreadable, so state coverage begins in 1998. Metro comparisons require separate boundary work and are outside this analysis.
For differences in what wages buy between places, use RN Purchasing Power. The Nursing Pay Atlas supplies current wage levels and percentiles.
Citing this study
NurseRecruiter. RN Wage Trends: historical national and state wage comparisons through 2025. Published November 20, 2026. https://www.nurserecruiter.com/wiki/rn-wage-trends
Credit NurseRecruiter for the analysis and BLS for the wage and consumer-price estimates. Identify the comparison period used; the historical sections cover different occupational definitions and estimation methods.
Related topics
Sources
-
BLS, Occupational Employment and Wage Statistics archives (accessed 2026-11-20). Original national and state RN wage estimates; individual editions retained in the linked NurseRecruiter archives.
-
BLS, OEWS frequently asked questions (accessed 2026-11-20). Wage coverage, time-series limitations and method changes.
-
BLS, Nursing and the Great Recession (accessed 2026-11-20). Historical RN occupational scope and the 2012 separation.
-
BLS, 2018 Standard Occupational Classification manual (accessed 2026-11-20). RN crosswalk and inclusion of clinical nurse specialists.
-
BLS, historical CPI-U through December 2023 (accessed 2026-11-20).
-
BLS, CPI historical tables for U.S. city average (accessed 2026-11-20). Monthly all-items CPI-U, not seasonally adjusted.
-
BLS, purchasing power and constant dollars (accessed 2026-11-20).
-
BLS, May 2023 technical notes (accessed 2026-11-20). Six-panel reference periods and estimation method.
-
BLS, OEWS history (accessed 2026-11-20). Earlier survey reference dates.
-
NurseRecruiter, Average RN pay reached six figures, with the smallest gain in four years (accessed 2026-11-20). Mean-wage release coverage; not the source of the median comparisons.