
A NurseRecruiter study of where RN pay goes furthest.
2024 edition · May 2024 wages and 2024 regional prices
California’s high living costs do not erase its lead in RN pay. Its median wage was worth $60.94 an hour at average U.S. prices, the highest among the 50 states and Washington, D.C. Florida ranked 30th in hourly pay but 49th after local prices were taken into account.
For RN Purchasing Power, NurseRecruiter matched median gross registered nurse wages from the Bureau of Labor Statistics with regional prices from the Bureau of Economic Analysis. Our analysis covers all 50 states, D.C. and 380 metro areas. It shows what local prices change about the wage comparison—and where a higher hourly rate can still buy less.
See the complete 2024 state and metro rankings. Rank 1 means the highest wage or purchasing power in its respective ranking. Comparisons of wage rank with purchasing-power rank use the same year. Annual changes are reported separately below.
Where RN pay buys more
California, Hawaii and Oregon led both rankings. Their median hourly wages were worth $60.94, $59.61 and $57.67 respectively at U.S. prices. California’s actual median was $67.47; its higher prices reduced that amount’s purchasing power without erasing the lead.
Elsewhere, prices changed the ordering more sharply. Florida’s median hourly wage of $39.83 became $38.52 at average U.S. prices. Arkansas paid a lower median of $37.08, but its lower prices gave that wage purchasing power of $42.65.
Arkansas ranked 47th in wages and 30th in purchasing power; Louisiana ranked 44th and 27th. Both ranked 17 places higher after adjustment, the largest difference in that direction among states and D.C. Florida ranked 19 places lower after adjustment, the largest difference in the other direction.
These adjusted amounts express buying power at national average prices, rather than the hourly rate an employer pays.
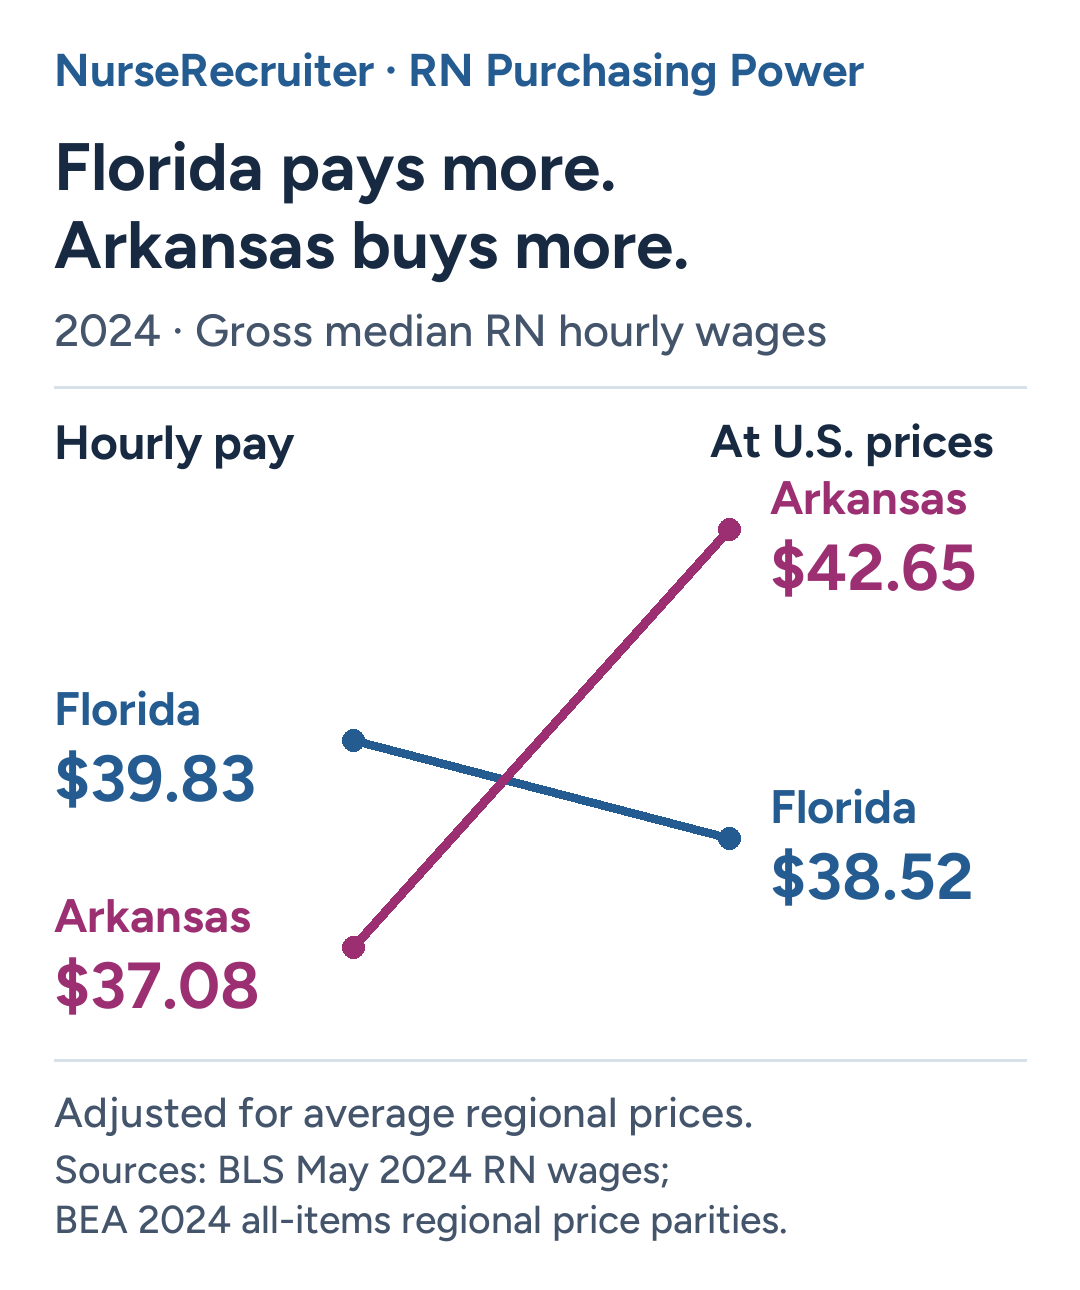
Florida paid more per hour, but Arkansas’s lower prices reversed the comparison. NurseRecruiter analysis of May 2024 BLS median RN wages and BEA’s 2024 all-items regional price parities.
What changed from 2023
Median RN pay outpaced regional prices in 36 states from 2023 to 2024; it fell behind in 14 states and D.C. Oregon had the largest estimated gain in real purchasing power, 10.4%; New Hampshire followed at 10.2%. Oregon remained third in purchasing-power rank despite its gain. Delaware's 4.2% decline was the largest among the 50 states and D.C.
New Hampshire's median hourly wage rose from $41.65 to $46.55 while regional prices rose 1.4%. Its purchasing-power rank improved from 46th to 17th, the largest rise. Montana's wage increased from $38.06 to $39.21, but prices rose 6.7%. Its real purchasing power fell 3.5%, and its rank dropped from 23rd to 43rd, the largest fall.
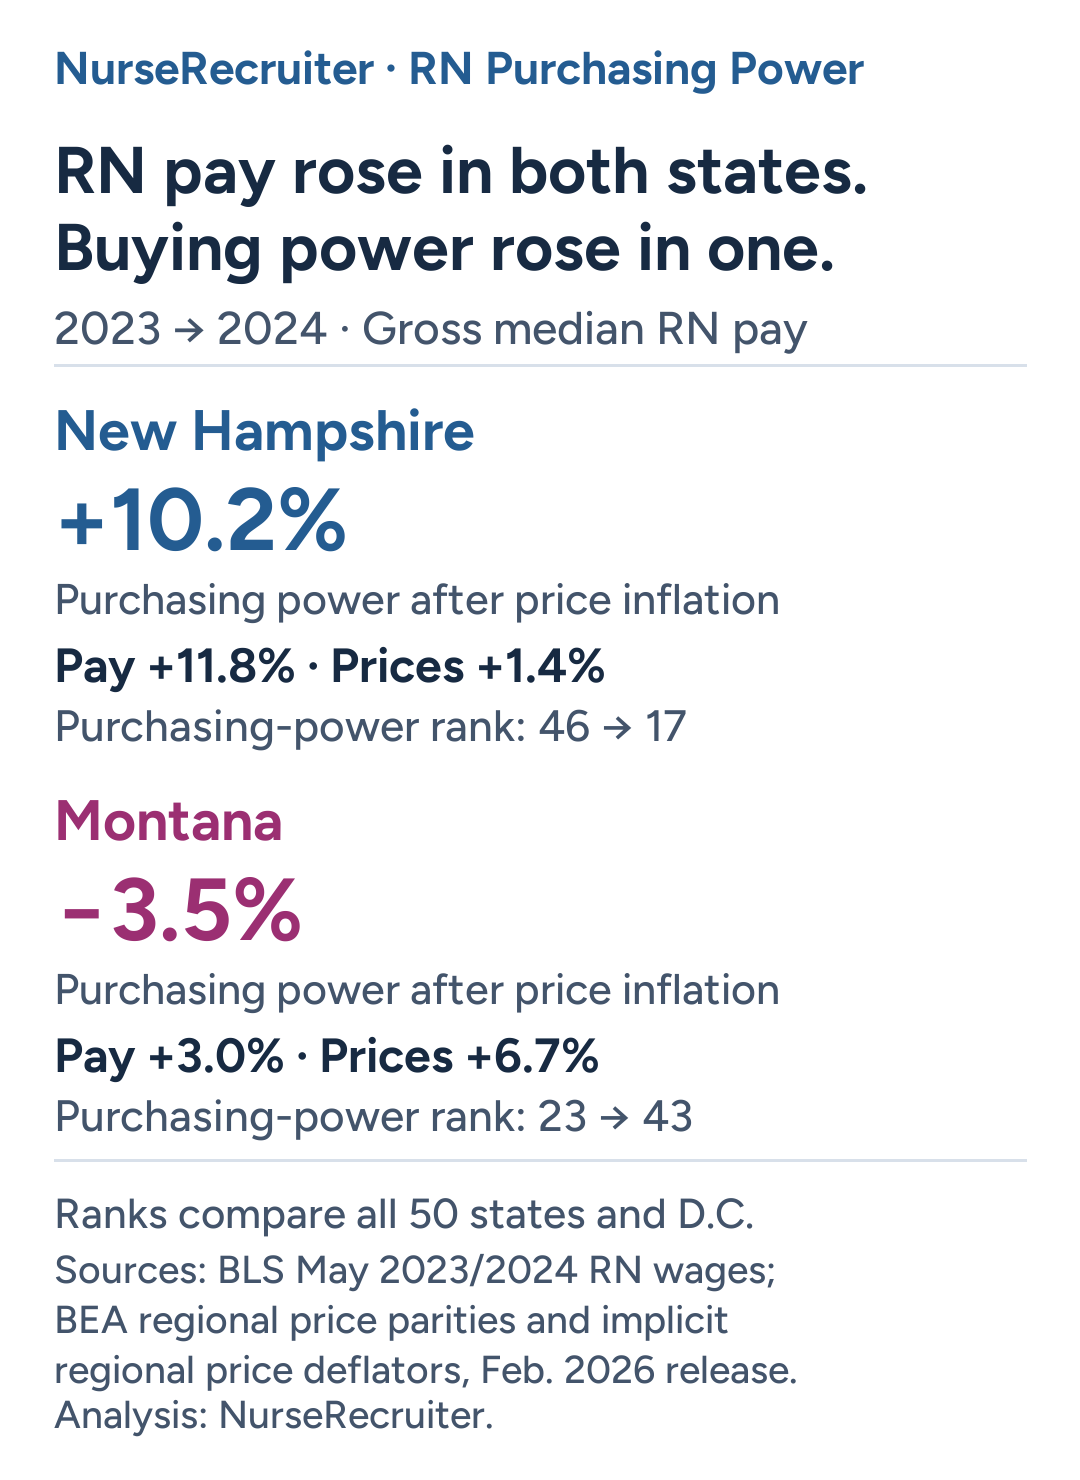
These comparisons use BEA's regional inflation measure as well as local price levels. They describe changes in survey estimates, not raises received by the same nurses. The complete state changes show wages, price changes, real pay changes and both years' ranks. A separate matched-metro comparison below accounts for the 2024 reporting-boundary changes.
Metro rankings
State averages can hide differences within a state. San Jose–Sunnyvale–Santa Clara led the metro purchasing-power ranking at $90.97 an hour, followed by Vallejo at $85.30. Both also led the ranking of actual median wages. San Francisco–Oakland–Fremont ranked third in wages and fifth in purchasing power, at $78.19.
The relationship can reverse even between nearby markets. Dallas–Fort Worth–Arlington paid a median $47.47 an hour, slightly more than Houston–Pasadena–The Woodlands at $47.02. After local prices, Houston came out ahead: $47.67 versus $46.05 at U.S. prices.
Miami–Fort Lauderdale–West Palm Beach shows a larger difference between pay and purchasing power. Its $41.16 median wage ranked 142nd of 380 metros, but its purchasing power of $36.06 ranked 378th. Monroe, Louisiana, paid $4.89 less per hour, yet its median wage had $7.33 more purchasing power. Miami had the largest downward difference between the two metro ranks; Monroe had the largest upward difference.
These are metro-wide estimates, not figures for the cities alone. The 2024 rankings show actual and adjusted wages together, so a rank does not have to stand in for the size of a difference. Santa Cruz–Watsonville and Modesto, for example, rank third and fourth in purchasing power, but both round to $78.26. Their unrounded difference is less than a cent, not a meaningful advantage.
Metro changes from 2023
Among 269 metros with comparable boundaries and usable wage and price data, median RN pay gained purchasing power in 161 and lost ground in 108 from 2023 to 2024. Santa Cruz–Watsonville, California, had the largest estimated real gain, 33.8%: its median hourly wage rose from $64.28 to $86.01, while BEA's regional price measure was unchanged. Muskegon–Norton Shores, Michigan, had the largest estimated decline, 11.4%. Its median fell from $41.93 to $38.43 while regional prices rose 3.5%.
Santa Cruz–Watsonville rose from 18th to 3rd in purchasing power within the matched group; Muskegon–Norton Shores fell from 53rd to 195th. Both years' ranks compare the same 269 metros, not the full 380-metro ranking above. These are changes in regional survey estimates, not raises or pay cuts received by the same nurses. The complete metro changes and unavailable comparisons identify the 111 ranked metros without a verified annual comparison.
What this study measures
RN Purchasing Power compares gross employee pay with an average basket of regional prices. It does not estimate take-home pay, an individual household’s budget or the wage a particular nurse will be offered. Differences in family size, housing and spending can change which location is more affordable for an individual reader.
Housing is part of the all-items price index, but this measure does not isolate a renter’s costs. NurseRecruiter’s Rent in RN Hours asks a narrower question: how many gross RN work hours cover a two-bedroom rent benchmark. Use that study when rent is the deciding expense.
For benefits, Health Insurance in RN Hours compares average employee contributions for family coverage with RN pay. Its insurance figures cover private-sector workers across occupations, not nurses specifically. These separate measures add context; their ranks are not combined into this purchasing-power ranking.
Method and coverage
NurseRecruiter matched BLS May 2024 Occupational Employment and Wage Statistics for registered nurses, occupation 29-1141, with BEA’s 2024 all-items regional price parities. We used median hourly wages across all industries and ownership types. The BLS state file includes the Colorado estimates released in July 2025.
BEA sets the national price level at 100. A regional index of 110 means the average price level is 10% above the U.S. average; an index of 90 means it is 10% below. We calculated:
Purchasing power per hour = median RN hourly wage × 100 ÷ regional price index
The state ranking covers 50 states and D.C. The separate metro ranking covers 380 of the 387 U.S. metro areas in BEA’s file. Both agencies' methods cite the July 2023 federal metro delineations. Eight published county lists could not be reconciled between BLS and OMB/BEA: Boston, Providence, Chicago, Cincinnati, Kansas City, Omaha, Philadelphia and Virginia Beach. These may be documentation omissions; the underlying series have not been shown to exclude those counties. Their 2024 code-matched values remain in the ranking, but none receives an annual comparison. See the unavailable metro comparisons for the affected areas and reasons.
Seven metros lack a usable RN median. BLS suppresses the medians for Durham–Chapel Hill, Flagstaff, Harrisonburg, Jackson, Michigan, and Napa. Gainesville, Georgia, and Midland, Michigan, have no RN occupation row. These metros are excluded from the wage rankings. Territories and nonmetropolitan areas are outside this study’s coverage.
Rankings use unrounded calculations, with shared ranks for exactly equal values. Displayed dollar amounts are rounded to cents, so two places showing the same amount can have different ranks. Small differences should not be treated as statistically significant.
BEA released the 2024 price data on February 19, 2026. As checked on November 20, 2026, 2024 was the latest available common reference year for this wage-and-price comparison. The 2024 results preserve this edition’s complete rankings; the Nursing Pay Atlas places the study alongside broader RN pay comparisons.
The underlying 2024 BLS RN wage tables and 2024 BEA price indexes are also archived as readable articles.
NurseRecruiter previously explored these comparisons in its reporting on 2023 RN wages adjusted for regional prices. That analysis used mean wages; this study uses medians, so the two are not a year-over-year comparison.
Citing this study
Credit the findings and rankings to NurseRecruiter’s RN Purchasing Power study, 2024 edition, and link to this article or the dated results. Identify BLS May 2024 median RN wages and BEA 2024 regional price parities as the ranking inputs. State and matched-metro annual changes also use May 2023 wages and BEA implicit regional price deflators for both years.
Related topics
- Nursing Pay Atlas: compare RN pay across places and types of work.
- Rent in RN Hours: compare a two-bedroom rent benchmark with RN hourly pay.
- Health Insurance in RN Hours: compare employee family-plan premiums with RN pay.
- 2024 RN Purchasing Power rankings: inspect all state and metro results for this edition.
Sources
Analysis and rankings: NurseRecruiter, RN Purchasing Power. Underlying wages and price indexes: BLS and BEA. Sources checked November 20, 2026.
-
BLS May 2024 state occupational wage data: median hourly wages for registered nurses, including the supplemental Colorado estimates.
-
BLS May 2024 metropolitan and nonmetropolitan occupational wage data: metro RN median hourly wages; nonmetropolitan rows are outside this study.
-
BLS May 2024 technical notes: definitions, coverage and geographic delineations.
-
BEA regional price parities: 2024 all-items state and metro price indexes.
-
NurseRecruiter’s earlier analysis of 2023 RN wages adjusted for regional prices: background reporting using mean wages, a different measure from this edition’s medians.
-
BEA February 19, 2026 release: release of 2024 regional price statistics.
-
BLS May 2023 state occupational wage data: RN median hourly wages for the annual comparison; retained source checked November 20, 2026.
-
BEA regional state data archive: SAIRPD implicit regional price deflators and SARPP all-items regional price parities, 2023 and 2024 observations from the February 19, 2026 release; retained source checked November 20, 2026.
-
BEA regional price methodology: regional price levels and implicit price growth; accessed November 20, 2026.
-
BLS notice on May 2024 metro delineation changes: boundary changes and replacement of New England city-and-town areas; accessed November 20, 2026.
-
BLS OEWS frequently asked questions: overlapping survey panels and limits on comparisons over time; accessed November 20, 2026.
-
BLS May 2023 metropolitan wage data: median hourly RN wages for the matched-metro comparison; retained source checked November 20, 2026.
-
BLS May 2023 geographic definitions and May 2024 definitions: county and county-equivalent component lists; accessed November 20, 2026.
-
July 2023 OMB metro delineations, Census workbook: independent territory check against the definitions used by BEA; retained source checked November 20, 2026.
-
BEA metro price archive: MARPP all-items price parities and MAIRPD implicit regional price deflators for 2023 and 2024, February 19, 2026 release; retained source checked November 20, 2026.