
Absolute risk describes the probability of an event in a defined group over a defined period. Relative risk compares two risks by division. Both descriptions can be correct while giving a reader a different impression of the size of a difference. Report them together when possible, keeping the outcome, population, comparator, and time period attached.
A risk is not the same as a rate based on person-time. An odds ratio is also not interchangeable with a risk ratio. Use the measure the study actually estimated.
A worked illustrative comparison
Suppose an invented study reports an event in 20 of 1,000 people receiving usual care and 10 of 1,000 receiving a new approach during the same follow-up period.
The risks are 2% and 1%. Comparing the new approach with usual care gives a risk ratio of 0.5: 1% divided by 2%. The relative risk reduction is 50%. The absolute risk reduction is 1 percentage point: 2% minus 1%. Expressed as natural frequencies, there are 10 fewer events per 1,000 people.
These are different expressions of the same illustrative data. The new approach did not reduce risk by 50 percentage points. Nor do these counts establish a reliable causal effect without information about design and uncertainty.
Why baseline risk matters
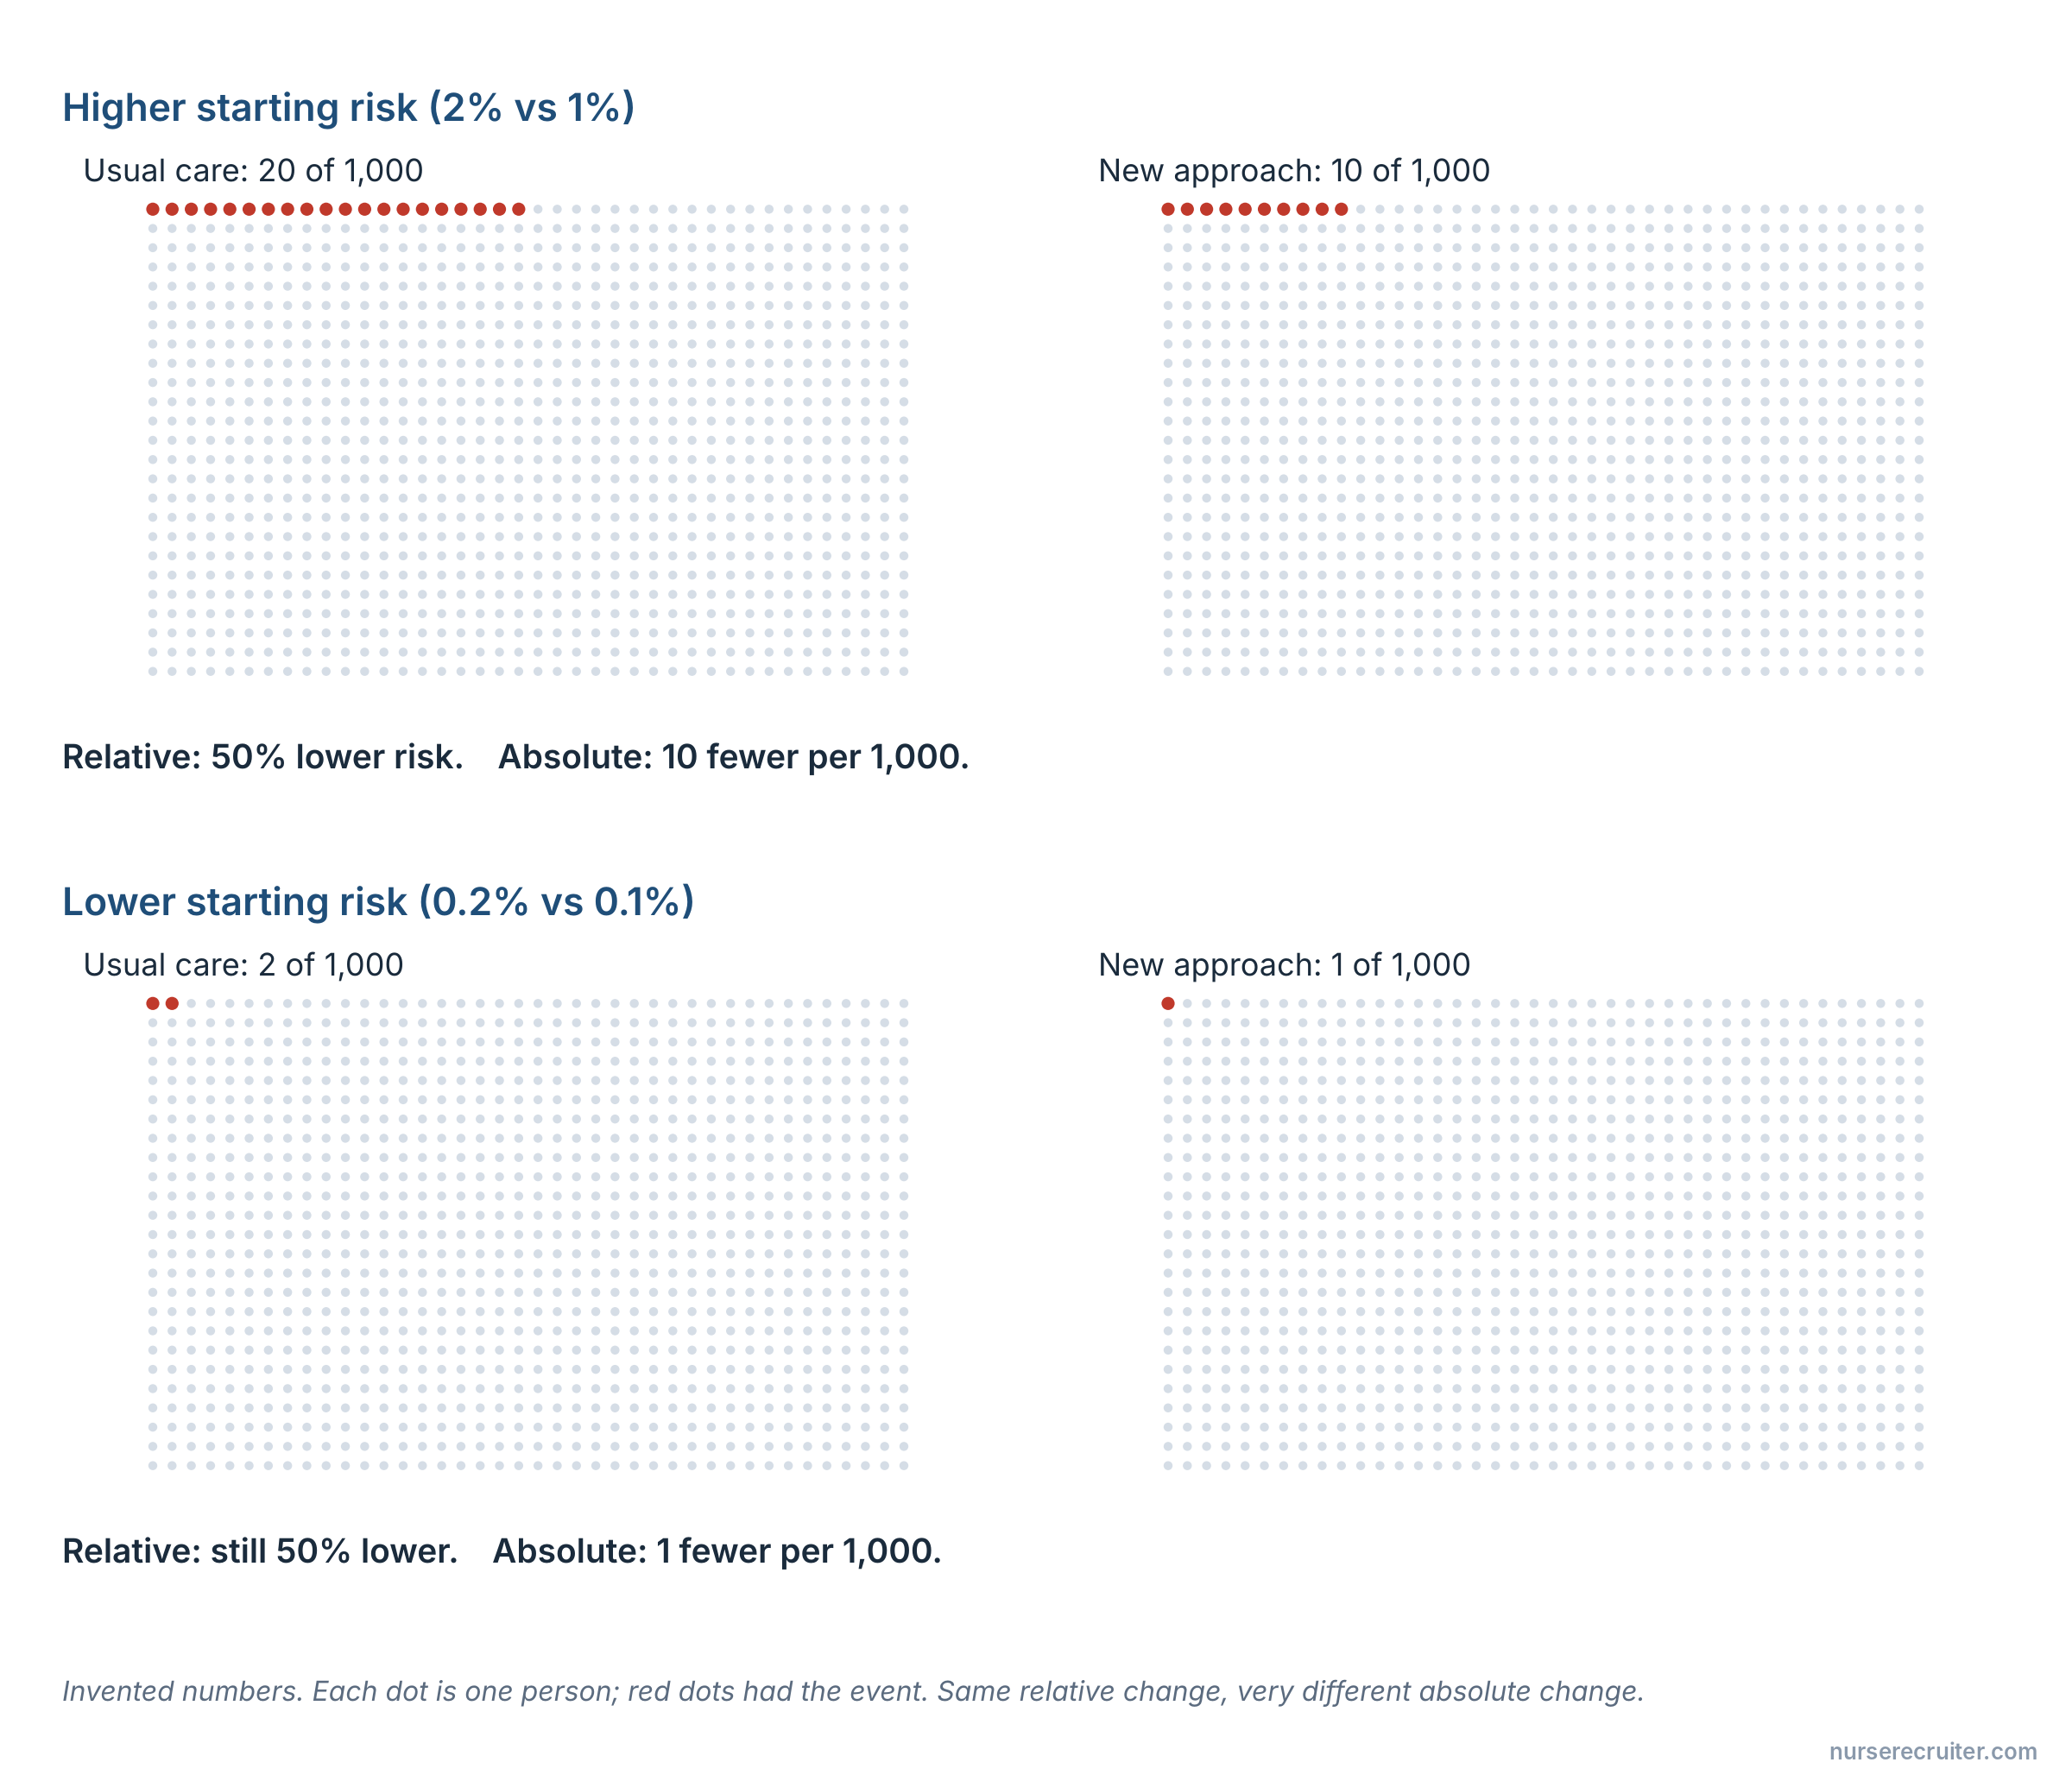
Now imagine a different population with risks of 0.2% and 0.1% over the same period. The risk ratio is again 0.5 and the relative reduction again 50%, but the absolute difference is 0.1 percentage point, or one fewer event per 1,000 people.
The second scenario is also hypothetical. It shows why a large-sounding relative reduction can correspond to a small absolute change. A result should not be transferred to a population with a different starting risk by assuming the same absolute benefit.
Number needed to treat
When an absolute risk reduction appropriately represents an intervention effect, its reciprocal gives the number needed to treat for one additional beneficial outcome over that period. A reduction of 0.01 corresponds to 100. Use the decimal risk difference, not the number of percentage points, in that calculation.
This is an expected comparison, not a guarantee that exactly one person in every group of 100 benefits. It also does not summarize harms, workload, costs, or patient preferences. Estimates can be uncertain, especially when events are uncommon.
Read a headline critically
Before repeating “risk cut in half,” find the actual event counts, denominators, follow-up, effect measure, and uncertainty interval. Ask whether the result is adjusted and whether the study supports causal language. If baseline risks are unavailable, acknowledge that the absolute effect cannot be recovered reliably from a relative figure alone.
See confidence intervals for nurses for expressing uncertainty around an estimate.
After calculating an absolute difference, consider whether the difference is clinically meaningful.
Sources
- CDC Principles of Epidemiology: Measures of Association (archived teaching chapter) (accessed 2026-09-17).
- Cochrane Handbook, Chapter 6: Choosing effect measures and computing estimates of effect (accessed 2026-09-17).
- Cochrane Handbook, Chapter 15: Interpreting results and drawing conclusions (accessed 2026-09-17).