
California’s median two-bedroom rent was $366 a month higher than Florida’s in 2025. Yet at the median registered nurse wage in each state, covering one month’s rent took 33.2 hours in California and 46.3 hours in Florida.
The state rankings use Census median gross rent for occupied two-bedroom homes, including longstanding leases. Metro rankings use HUD’s two-bedroom Fair Market Rent for recent movers. Both rent measures include basic tenant-paid utilities.
2025 rankings · States and D.C. · Metro areas · Why some metros are missing · Methods and sources
State rankings
Rent took the most RN work hours in D.C. (51.5 hours), followed by Florida (46.3) and Massachusetts (42.2). For an RN paid the local median wage for 40 hours a week year-round, those rents would take 29.7%, 26.7% and 24.3% of gross pay, respectively.
Nationally, the Census Bureau’s median monthly gross rent for an occupied two-bedroom home was $1,563 in 2025. At the national median RN wage of $46.90 an hour, rent took 33.3 hours.
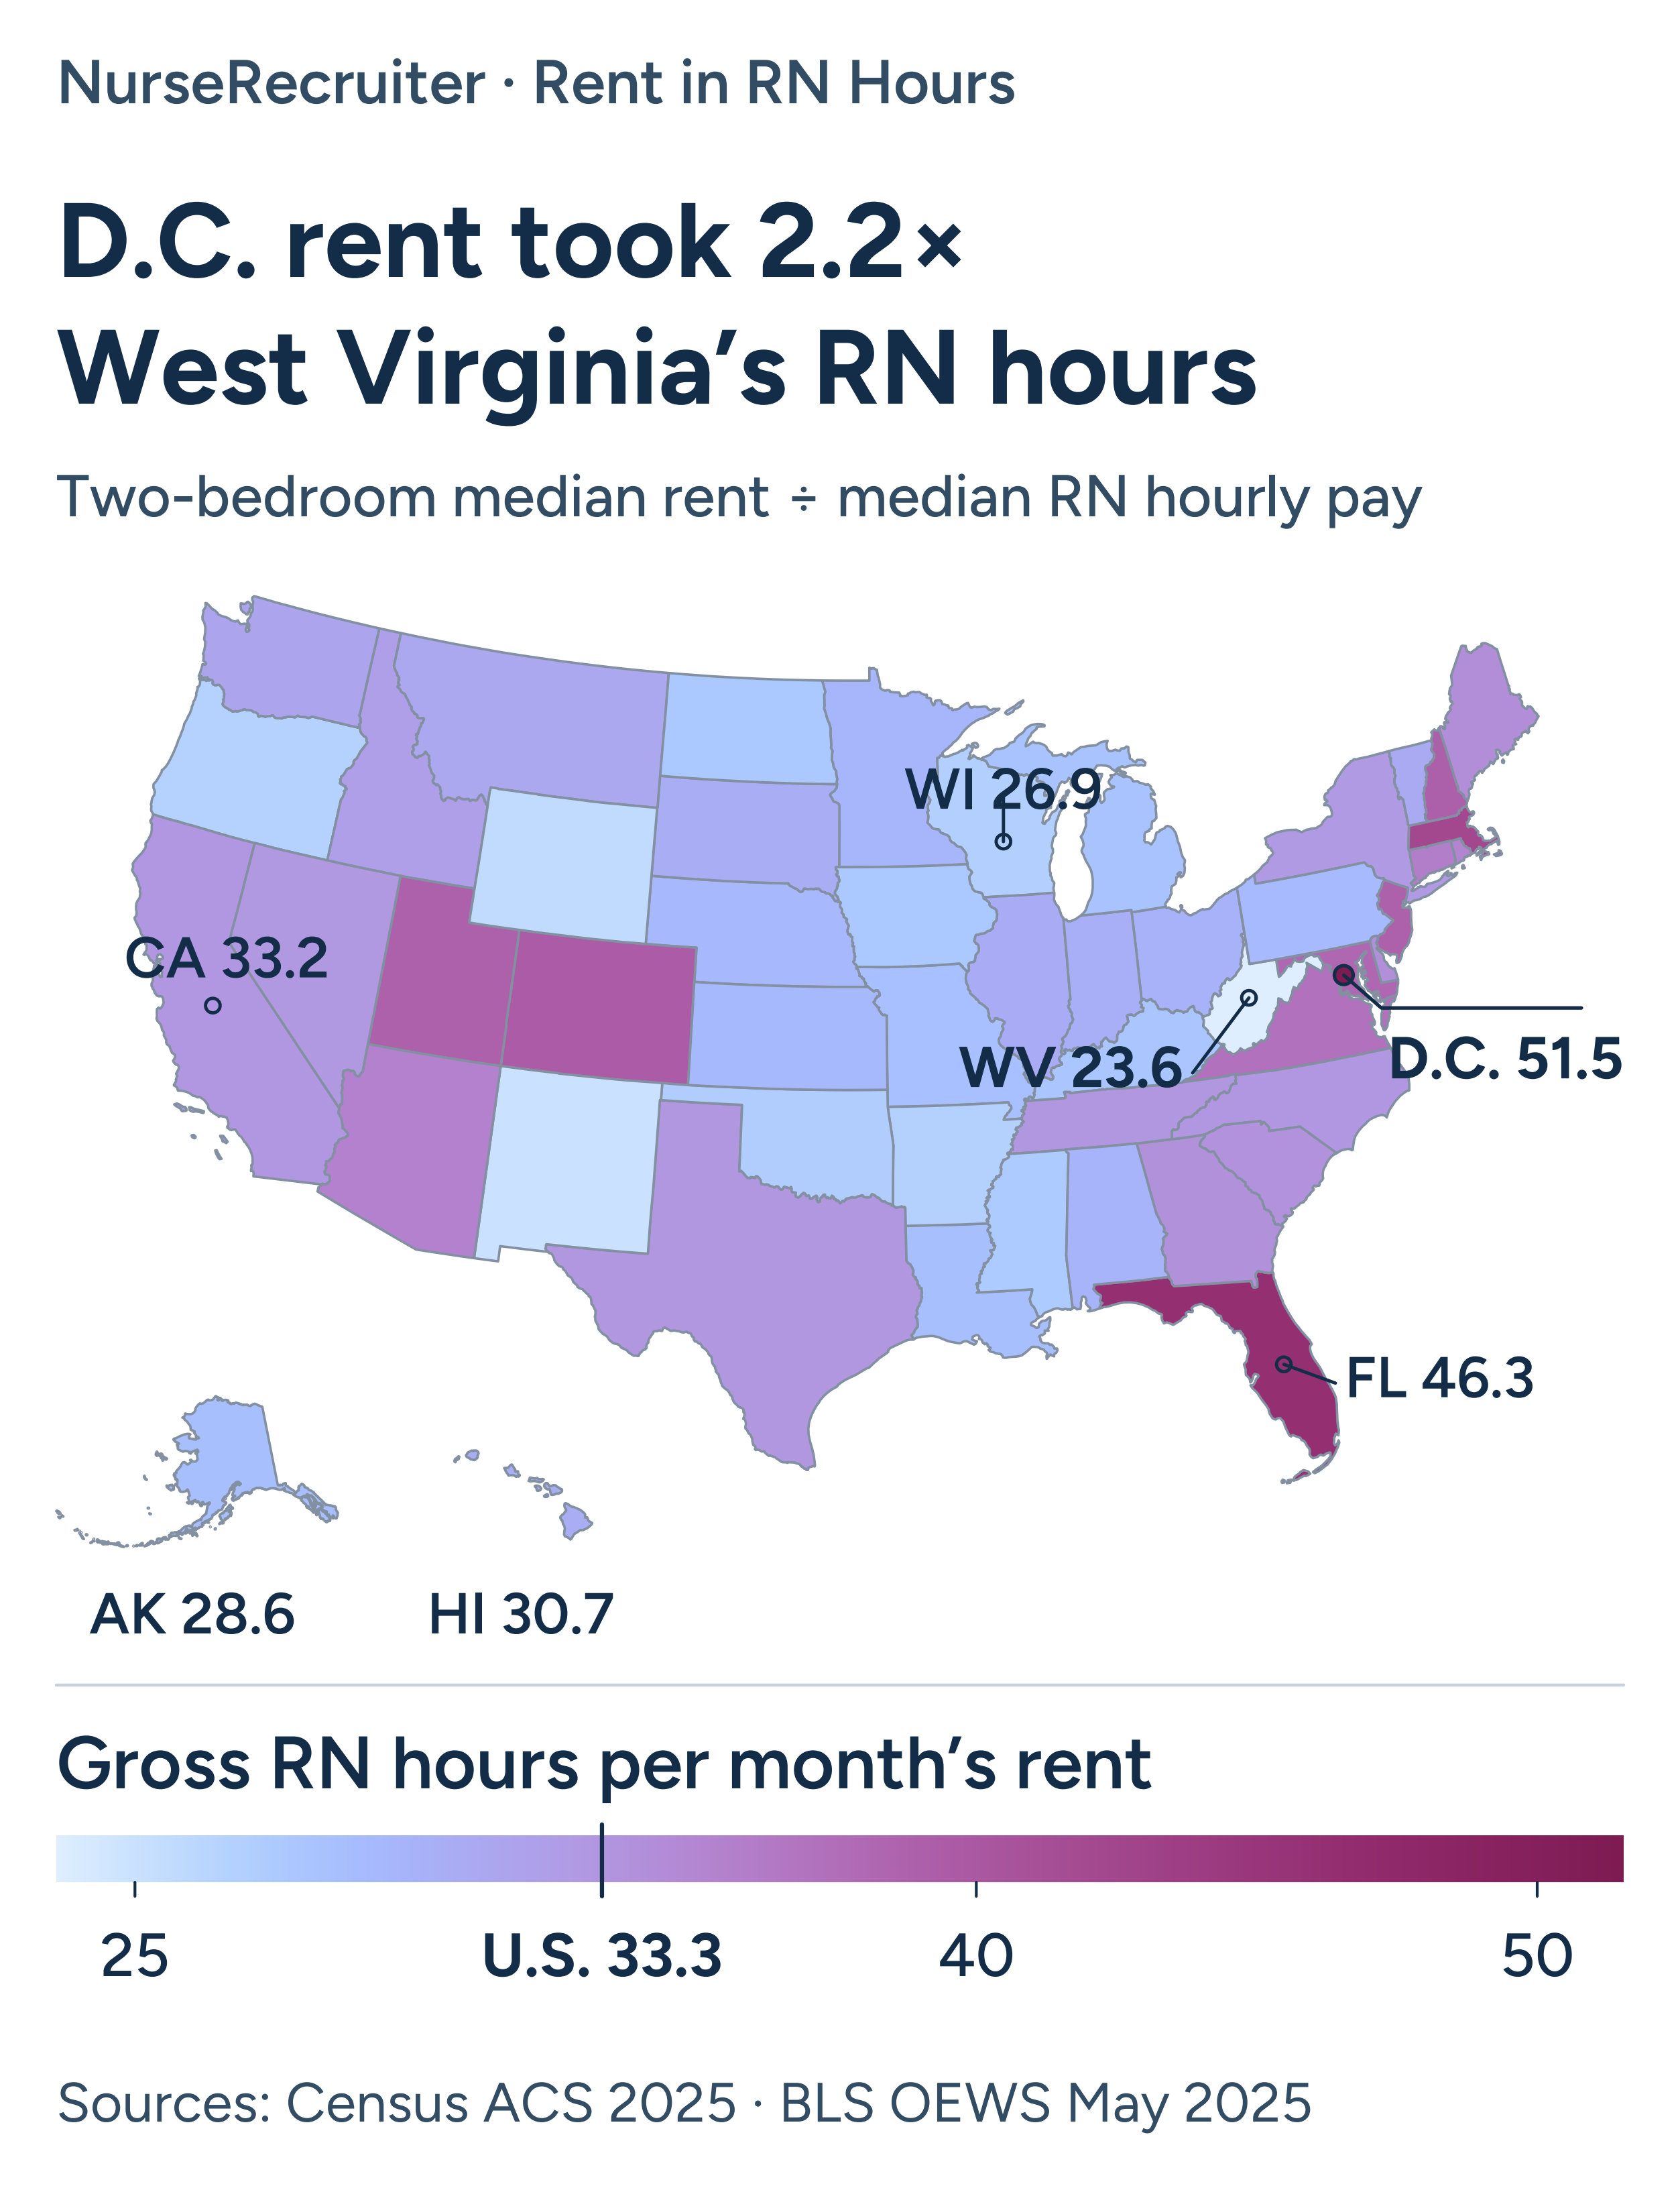
All 12 Midwest states fell below the national figure, ranging from 26.9 hours in Wisconsin to 30.7 in Illinois.
Metro rankings
Santa Cruz–Watsonville, California, had the highest ratio among the 224 eligible metros: 51.4 hours of median RN pay for a month of HUD’s two-bedroom rent benchmark. Orlando followed at 48.7, then Tampa at 48.1. Flint, Michigan, took the fewest hours (21.0). California had three markets among the ten lowest and three among the ten highest. The median across ranked metros was 29.2 hours.
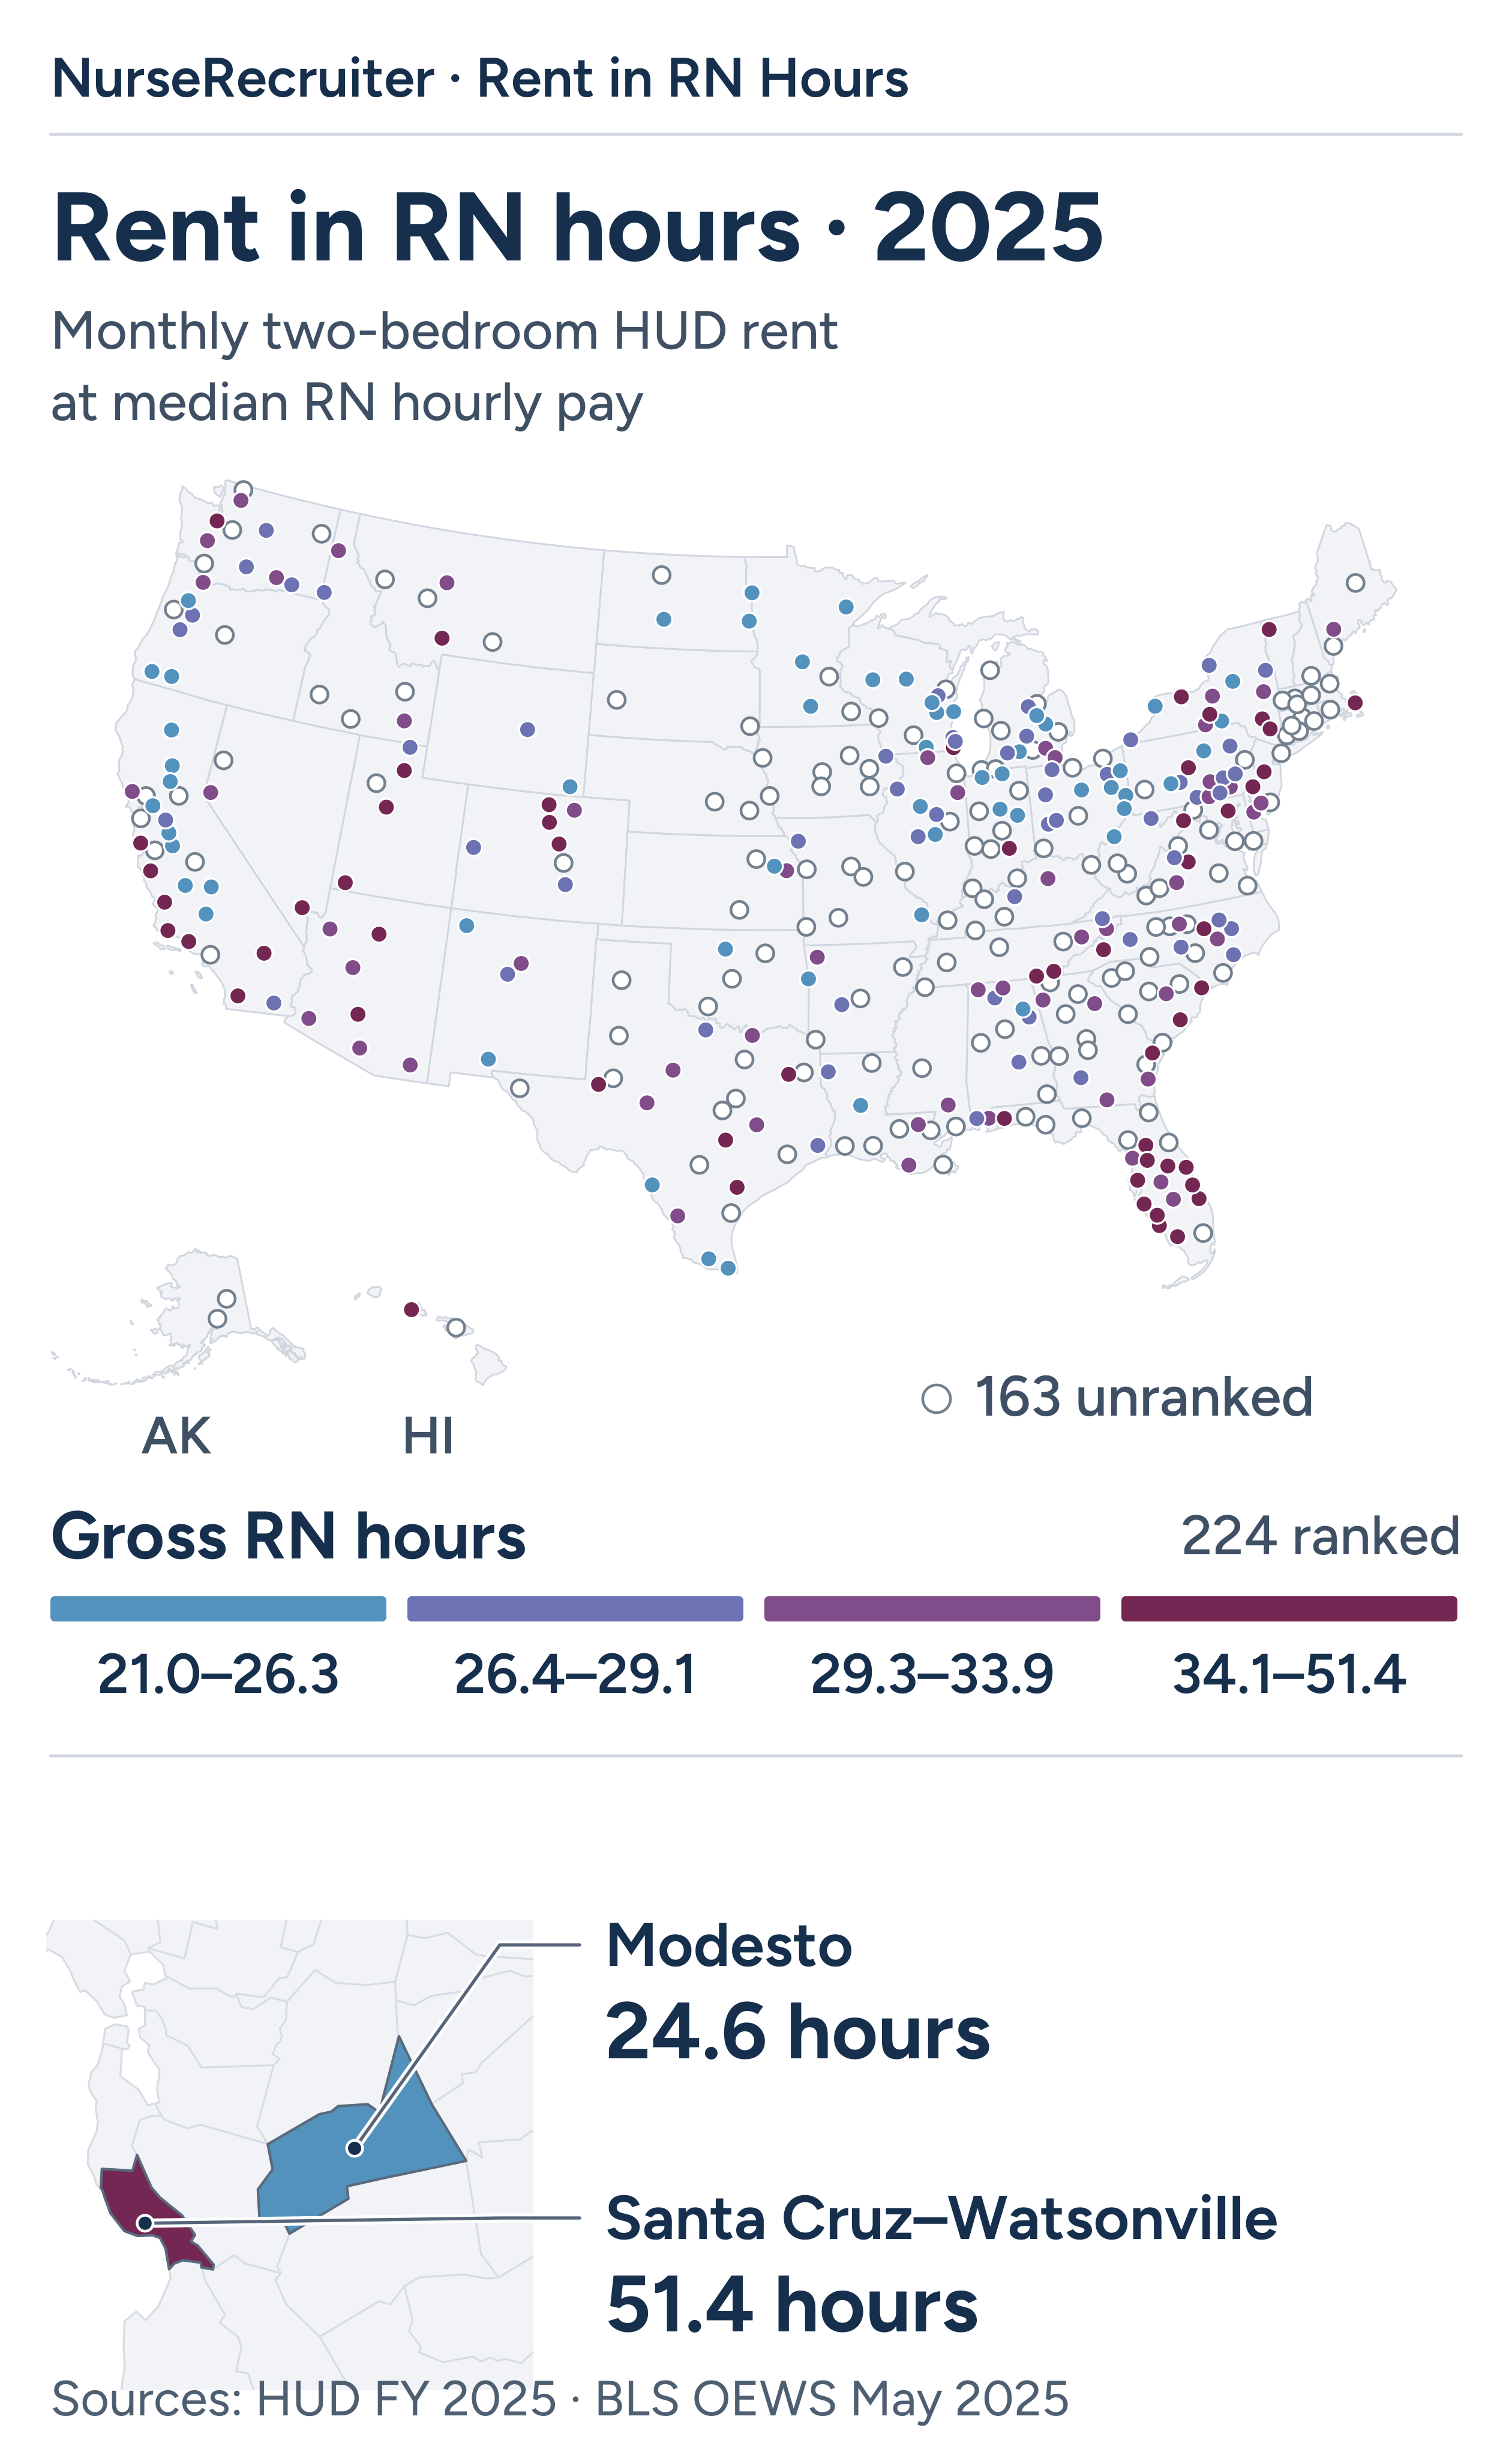
Santa Cruz–Watsonville’s median RN wage was $18.44 an hour higher than Modesto’s. Its two-bedroom rent benchmark was $2,657 a month higher.
How far does a higher hourly wage go?
Even at Santa Cruz–Watsonville’s 75th-percentile RN wage ($101.14 an hour), a month of HUD’s two-bedroom rent benchmark took 41.8 hours. At Modesto’s 25th-percentile RN wage ($59.62), the rent benchmark took 26.3 hours. The companion analysis explores what these rent and pay differences mean when comparing jobs.
Across the same 224 metros, a month of HUD’s two-bedroom Fair Market Rent took 32.3 hours at the local 25th-percentile RN wage, 29.2 hours at the median wage and 25.0 hours at the 75th-percentile wage. Each figure is the median of the 224 local rent-to-wage calculations.
Rent hours over time
At the local median RN wage, Santa Cruz–Watsonville’s two-bedroom rent benchmark took 29.8 hours in 2018 and 51.4 in 2025. Flint’s took 21.7 hours in 2018 and 21.0 in 2025. Both markets kept the same county boundaries.
Historical metro rankings, 2018–2025.
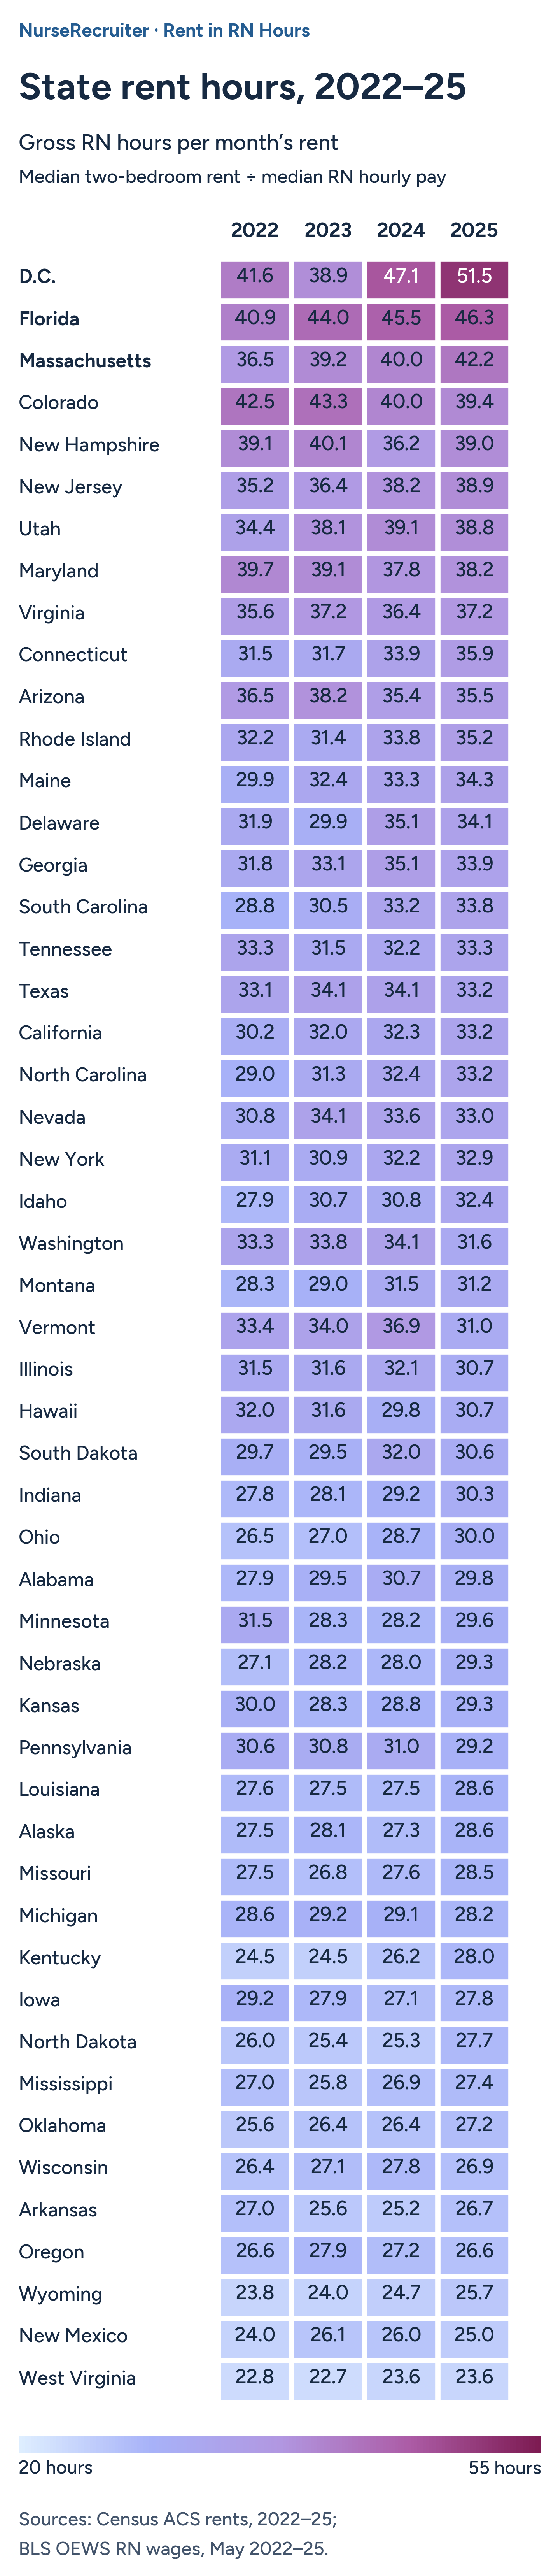
Census raised its rent-processing ceiling in 2024. Differences across that break can reflect the processing change; small differences can also reflect sampling error.
Historical state rankings and the rent and wage figures for each year.
State results from most to fewest hours
Rank 1 means rent took the most RN hours. A positive move is a climb toward rank 1 since 2024. The last column shows how much the hours changed, in hours and percent, using unrounded figures.
D.C. took 4.5 more hours than in 2024. Texas, California and North Carolina all round to 33.2 hours in 2025.
| Rank | Move | State or D.C. | RN hours | Change vs 2024 |
|---|---|---|---|---|
| 1 | 0 | District of Columbia | 51.5 | +4.5 h (+9.5%) |
| 2 | 0 | Florida | 46.3 | +0.8 h (+1.7%) |
| 3 | +1 | Massachusetts | 42.2 | +2.2 h (+5.4%) |
| 4 | -1 | Colorado | 39.4 | -0.6 h (-1.5%) |
| 5 | +5 | New Hampshire | 39.0 | +2.7 h (+7.5%) |
| 6 | 0 | New Jersey | 38.9 | +0.7 h (+1.8%) |
| 7 | -2 | Utah | 38.8 | -0.2 h (-0.6%) |
| 8 | -1 | Maryland | 38.2 | +0.5 h (+1.2%) |
| 9 | 0 | Virginia | 37.2 | +0.8 h (+2.1%) |
| 10 | +6 | Connecticut | 35.9 | +1.9 h (+5.7%) |
| 11 | 0 | Arizona | 35.5 | +0.1 h (+0.3%) |
| 12 | +5 | Rhode Island | 35.2 | +1.4 h (+4.0%) |
| 13 | +6 | Maine | 34.3 | +1.0 h (+3.0%) |
| 14 | -2 | Delaware | 34.1 | -1.0 h (-2.9%) |
| 15 | -2 | Georgia | 33.9 | -1.2 h (-3.4%) |
| 16 | +4 | South Carolina | 33.8 | +0.6 h (+1.8%) |
| 17 | +6 | Tennessee | 33.3 | +1.1 h (+3.4%) |
| 18 | -4 | Texas | 33.2 | -0.9 h (-2.5%) |
| 19 | +3 | California | 33.2 | +0.9 h (+2.8%) |
| 20 | +1 | North Carolina | 33.2 | +0.7 h (+2.3%) |
| 21 | -3 | Nevada | 33.0 | -0.6 h (-1.7%) |
| 22 | +2 | New York | 32.9 | +0.7 h (+2.1%) |
| 23 | +6 | Idaho | 32.4 | +1.5 h (+5.0%) |
| 24 | -9 | Washington | 31.6 | -2.5 h (-7.3%) |
| 25 | +2 | Montana | 31.2 | -0.2 h (-0.7%) |
| 26 | -18 | Vermont | 31.0 | -5.9 h (-15.9%) |
| 27 | -2 | Illinois | 30.7 | -1.4 h (-4.4%) |
| 28 | +3 | Hawaii | 30.7 | +0.9 h (+2.9%) |
| 29 | -3 | South Dakota | 30.6 | -1.5 h (-4.5%) |
| 30 | +2 | Indiana | 30.3 | +1.2 h (+4.1%) |
| 31 | +4 | Ohio | 30.0 | +1.3 h (+4.4%) |
| 32 | -2 | Alabama | 29.8 | -0.9 h (-3.0%) |
| 33 | +3 | Minnesota | 29.6 | +1.3 h (+4.8%) |
| 34 | +3 | Nebraska | 29.3 | +1.3 h (+4.5%) |
| 35 | -1 | Kansas | 29.3 | +0.4 h (+1.5%) |
| 36 | -8 | Pennsylvania | 29.2 | -1.8 h (-5.9%) |
| 37 | +3 | Louisiana | 28.6 | +1.2 h (+4.4%) |
| 38 | +3 | Alaska | 28.6 | +1.3 h (+4.8%) |
| 39 | 0 | Missouri | 28.5 | +0.9 h (+3.4%) |
| 40 | -7 | Michigan | 28.2 | -0.9 h (-3.1%) |
| 41 | +5 | Kentucky | 28.0 | +1.8 h (+6.8%) |
| 42 | +1 | Iowa | 27.8 | +0.6 h (+2.4%) |
| 43 | +5 | North Dakota | 27.7 | +2.5 h (+9.8%) |
| 44 | 0 | Mississippi | 27.4 | +0.5 h (+1.9%) |
| 45 | 0 | Oklahoma | 27.2 | +0.8 h (+2.9%) |
| 46 | -8 | Wisconsin | 26.9 | -0.9 h (-3.1%) |
| 47 | +2 | Arkansas | 26.7 | +1.5 h (+6.1%) |
| 48 | -6 | Oregon | 26.6 | -0.6 h (-2.1%) |
| 49 | +1 | Wyoming | 25.7 | +1.0 h (+4.0%) |
| 50 | -3 | New Mexico | 25.0 | -1.0 h (-4.0%) |
| 51 | 0 | West Virginia | 23.6 | 0.0 h (+0.2%) |
Historical state rankings, rents and wages.
All 224 metro ranks
Metros run from most to fewest RN hours. A positive move is a climb toward rank 1 since 2024. The number of ranked metros fell from 229 to 224, so a metro can move when others enter or leave. A dash means there’s no comparable 2024 figure.
| Rank | Move | Metro area | RN hours | Change vs 2024 |
|---|---|---|---|---|
| 1 | +1 | Santa Cruz-Watsonville, CA | 51.4 | +4.2 h (+9.0%) |
| 2 | -1 | Orlando-Kissimmee-Sanford, FL | 48.7 | +1.3 h (+2.8%) |
| 3 | +4 | Tampa-St. Petersburg-Clearwater, FL | 48.1 | +2.5 h (+5.4%) |
| 4 | +7 | Barnstable Town, MA | 47.2 | +3.5 h (+8.1%) |
| 5 | +15 | Cape Coral-Fort Myers, FL | 46.3 | +5.7 h (+14.2%) |
| 6 | +3 | Salinas, CA | 46.0 | +1.6 h (+3.7%) |
| 7 | -4 | Santa Maria-Santa Barbara, CA | 45.9 | -0.8 h (-1.7%) |
| 8 | 0 | North Port-Bradenton-Sarasota, FL | 44.6 | -1.0 h (-2.2%) |
| 9 | -5 | Denver-Aurora-Centennial, CO | 44.0 | -2.5 h (-5.3%) |
| 10 | +67 | Bozeman, MT | 43.7 | +12.9 h (+41.7%) |
| 11 | +10 | Raleigh-Cary, NC | 43.2 | +2.9 h (+7.2%) |
| 12 | -2 | San Diego-Chula Vista-Carlsbad, CA | 42.9 | -1.3 h (-3.0%) |
| 13 | +42 | Pensacola-Ferry Pass-Brent, FL | 42.9 | +9.6 h (+28.8%) |
| 14 | +10 | Odessa, TX | 42.7 | +3.3 h (+8.4%) |
| 15 | -1 | Trenton-Princeton, NJ | 42.2 | -0.4 h (-0.9%) |
| 16 | +12 | Palm Bay-Melbourne-Titusville, FL | 42.0 | +4.7 h (+12.6%) |
| 17 | -11 | Boulder, CO | 41.5 | -4.9 h (-10.5%) |
| 18 | -6 | Naples-Marco Island, FL | 41.5 | -2.1 h (-4.8%) |
| 19 | -4 | Austin-Round Rock-San Marcos, TX | 41.4 | -0.8 h (-1.8%) |
| 20 | -1 | Port St. Lucie, FL | 41.1 | +0.3 h (+0.8%) |
| 21 | -4 | Baltimore-Columbia-Towson, MD | 41.1 | -0.5 h (-1.3%) |
| 22 | -17 | Burlington-South Burlington, VT | 40.9 | -5.4 h (-11.7%) |
| 23 | -5 | Charleston-North Charleston, SC | 40.8 | -0.5 h (-1.1%) |
| 24 | +2 | Oxnard-Thousand Oaks-Ventura, CA | 40.7 | +1.7 h (+4.3%) |
| 25 | -3 | Phoenix-Mesa-Chandler, AZ | 40.2 | +0.4 h (+1.1%) |
| 26 | +10 | Urban Honolulu, HI | 40.1 | +4.3 h (+12.1%) |
| 27 | 0 | Sebastian-Vero Beach-West Vero Corridor, FL | 40.1 | +1.4 h (+3.5%) |
| 28 | — | Flagstaff, AZ | 40.1 | — |
| 29 | -13 | Bremerton-Silverdale-Port Orchard, WA | 39.9 | -2.2 h (-5.3%) |
| 30 | +10 | Ogden, UT | 38.9 | +3.5 h (+10.0%) |
| 31 | -18 | Asheville, NC | 38.6 | -4.7 h (-10.9%) |
| 32 | -9 | Kiryas Joel-Poughkeepsie-Newburgh, NY | 38.5 | -1.0 h (-2.5%) |
| 33 | +2 | Savannah, GA | 38.0 | +2.1 h (+5.8%) |
| 34 | +3 | Punta Gorda, FL | 37.8 | +2.1 h (+6.0%) |
| 35 | +18 | Chattanooga, TN-GA | 37.2 | +3.9 h (+11.6%) |
| 36 | -4 | Philadelphia-Camden-Wilmington, PA-NJ-DE-MD | 37.0 | +0.6 h (+1.7%) |
| 37 | -8 | Kingston, NY | 37.0 | -0.2 h (-0.5%) |
| 38 | +31 | Wildwood-The Villages, FL | 37.0 | +5.1 h (+15.9%) |
| 39 | +8 | State College, PA | 36.5 | +2.6 h (+7.5%) |
| 40 | -1 | San Luis Obispo-Paso Robles, CA | 36.5 | +1.0 h (+2.9%) |
| 41 | +4 | Myrtle Beach-Conway-North Myrtle Beach, SC | 36.3 | +2.0 h (+5.9%) |
| 42 | +1 | Kenosha, WI | 36.2 | +1.7 h (+5.0%) |
| 43 | -12 | Charlottesville, VA | 36.2 | -0.5 h (-1.3%) |
| 44 | -6 | Fort Collins-Loveland, CO | 36.1 | +0.7 h (+1.9%) |
| 45 | +21 | Riverside-San Bernardino-Ontario, CA | 35.8 | +3.7 h (+11.5%) |
| 46 | +2 | St. George, UT | 35.8 | +1.9 h (+5.8%) |
| 47 | +4 | Ithaca, NY | 35.3 | +1.8 h (+5.3%) |
| 48 | +2 | Las Vegas-Henderson-North Las Vegas, NV | 35.0 | +1.5 h (+4.4%) |
| 49 | -5 | Ocala, FL | 34.7 | +0.3 h (+0.8%) |
| 50 | +8 | Victoria, TX | 34.6 | +1.6 h (+4.9%) |
| 51 | +30 | Cleveland, TN | 34.6 | +4.2 h (+13.7%) |
| 52 | +4 | Tyler, TX | 34.5 | +1.3 h (+4.1%) |
| 53 | +7 | Provo-Orem-Lehi, UT | 34.5 | +1.7 h (+5.3%) |
| 54 | +50 | Rochester, NY | 34.3 | +5.7 h (+19.8%) |
| 55 | +6 | Columbus, IN | 34.2 | +1.6 h (+4.8%) |
| 56 | +15 | Winchester, VA-WV | 34.1 | +2.4 h (+7.7%) |
| 57 | 0 | Dover, DE | 33.9 | +0.9 h (+2.7%) |
| 58 | -33 | Huntsville, AL | 33.7 | -5.6 h (-14.3%) |
| 59 | -17 | Santa Fe, NM | 33.6 | -1.2 h (-3.5%) |
| 60 | +13 | Sherman-Denison, TX | 33.3 | +1.8 h (+5.6%) |
| 61 | -12 | Mount Vernon-Anacortes, WA | 33.2 | -0.4 h (-1.2%) |
| 62 | +5 | Lakeland-Winter Haven, FL | 33.1 | +1.0 h (+3.2%) |
| 63 | +82 | Great Falls, MT | 33.0 | +6.1 h (+22.5%) |
| 64 | -30 | Greeley, CO | 33.0 | -3.0 h (-8.4%) |
| 65 | +5 | San Angelo, TX | 32.7 | +1.0 h (+3.1%) |
| 66 | +35 | Santa Rosa-Petaluma, CA | 32.7 | +4.0 h (+13.8%) |
| 67 | -37 | Daphne-Fairhope-Foley, AL | 32.6 | -4.1 h (-11.3%) |
| 68 | -14 | Lancaster, PA | 32.3 | -1.0 h (-3.0%) |
| 69 | -6 | Ann Arbor, MI | 32.3 | -0.2 h (-0.7%) |
| 70 | +4 | Elmira, NY | 32.2 | +0.8 h (+2.6%) |
| 71 | +21 | Valdosta, GA | 32.0 | +3.0 h (+10.3%) |
| 72 | -8 | Vineland, NJ | 32.0 | -0.3 h (-1.0%) |
| 73 | +50 | Monroe, MI | 32.0 | +4.2 h (+15.1%) |
| 74 | +5 | Homosassa Springs, FL | 31.9 | +1.2 h (+3.9%) |
| 75 | -16 | Portland-Vancouver-Hillsboro, OR-WA | 31.9 | -1.0 h (-3.1%) |
| 76 | +42 | Brunswick-St. Simons, GA | 31.8 | +3.9 h (+14.0%) |
| 77 | +20 | Prescott Valley-Prescott, AZ | 31.8 | +2.9 h (+10.1%) |
| 78 | +21 | Laredo, TX | 31.7 | +2.9 h (+10.0%) |
| 79 | +40 | Syracuse, NY | 31.6 | +3.7 h (+13.2%) |
| 80 | -12 | Houma-Bayou Cane-Thibodaux, LA | 31.5 | -0.5 h (-1.5%) |
| 81 | +5 | Abilene, TX | 31.3 | +1.5 h (+4.9%) |
| 82 | -41 | Hattiesburg, MS | 31.2 | -4.1 h (-11.6%) |
| 83 | +41 | Lynchburg, VA | 31.0 | +3.2 h (+11.7%) |
| 84 | -4 | Athens-Clarke County, GA | 31.0 | +0.6 h (+1.9%) |
| 85 | -9 | Albany-Schenectady-Troy, NY | 30.9 | 0.0 h (+0.1%) |
| 86 | +34 | Lewiston-Auburn, ME | 30.7 | +2.8 h (+10.1%) |
| 87 | +42 | Coeur d'Alene, ID | 30.7 | +3.1 h (+11.3%) |
| 88 | -55 | Olympia-Lacey-Tumwater, WA | 30.7 | -5.4 h (-15.0%) |
| 89 | +1 | Lexington-Fayette, KY | 30.7 | +1.1 h (+3.7%) |
| 90 | -8 | Florence-Muscle Shoals, AL | 30.5 | +0.2 h (+0.5%) |
| 91 | -19 | Gettysburg, PA | 30.4 | -1.3 h (-4.1%) |
| 92 | +13 | Yuma, AZ | 30.4 | +1.8 h (+6.2%) |
| 93 | +71 | Rockford, IL | 30.4 | +4.1 h (+15.4%) |
| 94 | +1 | Tucson, AZ | 30.3 | +1.4 h (+4.7%) |
| 95 | +35 | Lawrence, KS | 30.3 | +2.8 h (+10.0%) |
| 96 | -11 | College Station-Bryan, TX | 30.2 | +0.3 h (+0.9%) |
| 97 | -6 | Kankakee, IL | 30.2 | +1.1 h (+3.6%) |
| 98 | +11 | Carson City, NV | 30.1 | +1.7 h (+6.0%) |
| 99 | +16 | Sebring, FL | 30.1 | +2.0 h (+7.1%) |
| 100 | +68 | Pocatello, ID | 30.1 | +3.8 h (+14.6%) |
| 101 | -7 | Burlington, NC | 30.1 | +1.1 h (+3.7%) |
| 102 | +11 | Lake Havasu City-Kingman, AZ | 30.0 | +1.7 h (+6.1%) |
| 103 | -14 | Hammond, LA | 30.0 | +0.3 h (+1.2%) |
| 104 | -21 | Johnson City, TN | 30.0 | -0.4 h (-1.2%) |
| 105 | +3 | Goldsboro, NC | 29.8 | +1.3 h (+4.7%) |
| 106 | +4 | Fayetteville-Springdale-Rogers, AR | 29.7 | +1.3 h (+4.5%) |
| 107 | -23 | Sumter, SC | 29.5 | -0.7 h (-2.3%) |
| 108 | +29 | Rome, GA | 29.5 | +2.2 h (+7.9%) |
| 109 | -34 | Harrisburg-Carlisle, PA | 29.5 | -1.5 h (-4.8%) |
| 110 | +15 | Morristown, TN | 29.4 | +1.6 h (+5.8%) |
| 111 | -33 | Kennewick-Richland, WA | 29.4 | -1.3 h (-4.4%) |
| 112 | +65 | Sierra Vista-Douglas, AZ | 29.3 | +3.4 h (+13.1%) |
| 113 | +43 | Akron, OH | 29.1 | +2.6 h (+9.9%) |
| 114 | +46 | Chambersburg, PA | 29.1 | +2.7 h (+10.2%) |
| 115 | +54 | Erie, PA | 29.1 | +2.8 h (+10.8%) |
| 116 | -23 | York-Hanover, PA | 29.0 | 0.0 h (0.0%) |
| 117 | +40 | Pinehurst-Southern Pines, NC | 29.0 | +2.5 h (+9.4%) |
| 118 | -31 | Staunton-Stuarts Draft, VA | 28.9 | -0.9 h (-3.0%) |
| 119 | -8 | Albuquerque, NM | 28.8 | +0.5 h (+1.6%) |
| 120 | +41 | Elizabethtown, KY | 28.7 | +2.3 h (+8.8%) |
| 121 | +14 | Lewiston, ID-WA | 28.7 | +1.3 h (+4.8%) |
| 122 | -60 | Mobile, AL | 28.6 | -4.0 h (-12.3%) |
| 123 | -16 | Reading, PA | 28.6 | +0.1 h (+0.3%) |
| 124 | -26 | Beaumont-Port Arthur, TX | 28.5 | -0.3 h (-1.2%) |
| 125 | +67 | Kingsport-Bristol, TN-VA | 28.3 | +3.1 h (+12.2%) |
| 126 | +29 | Scranton--Wilkes-Barre, PA | 28.3 | +1.7 h (+6.5%) |
| 127 | +43 | Logan, UT-ID | 28.2 | +2.0 h (+7.7%) |
| 128 | -82 | Jacksonville, NC | 28.2 | -5.9 h (-17.3%) |
| 129 | -27 | Decatur, AL | 28.1 | -0.6 h (-2.0%) |
| 130 | -27 | Bloomington, IL | 28.1 | -0.6 h (-2.0%) |
| 131 | +8 | Springfield, IL | 28.0 | +0.7 h (+2.6%) |
| 132 | +77 | Albany, GA | 27.9 | +4.0 h (+16.6%) |
| 133 | -45 | Greenville, NC | 27.9 | -1.8 h (-6.0%) |
| 134 | +15 | St. Joseph, MO-KS | 27.9 | +1.1 h (+3.9%) |
| 135 | +38 | Kalamazoo-Portage, MI | 27.9 | +1.8 h (+6.8%) |
| 136 | +14 | Lansing-East Lansing, MI | 27.8 | +1.0 h (+3.8%) |
| 137 | -20 | Watertown-Fort Drum, NY | 27.8 | -0.3 h (-1.0%) |
| 138 | -11 | Morgantown, WV | 27.6 | 0.0 h (-0.1%) |
| 139 | +37 | Davenport-Moline-Rock Island, IA-IL | 27.6 | +1.8 h (+6.8%) |
| 140 | -28 | Montgomery, AL | 27.6 | -0.7 h (-2.6%) |
| 141 | +76 | El Centro, CA | 27.6 | +5.0 h (+22.2%) |
| 142 | -20 | Wenatchee-East Wenatchee, WA | 27.6 | -0.2 h (-0.8%) |
| 143 | +39 | Springfield, OH | 27.6 | +2.0 h (+7.9%) |
| 144 | 0 | Wichita Falls, TX | 27.5 | +0.4 h (+1.6%) |
| 145 | -5 | Hot Springs, AR | 27.4 | +0.2 h (+0.8%) |
| 146 | +16 | Lebanon, PA | 27.4 | +1.1 h (+4.1%) |
| 147 | — | Midland, MI | 27.4 | — |
| 148 | -10 | Eugene-Springfield, OR | 27.3 | +0.1 h (+0.3%) |
| 149 | -17 | Pueblo, CO | 27.3 | -0.2 h (-0.7%) |
| 150 | -8 | Hickory-Lenoir-Morganton, NC | 27.2 | 0.0 h (+0.1%) |
| 151 | +15 | Dayton-Kettering-Beavercreek, OH | 27.1 | +0.9 h (+3.3%) |
| 152 | -1 | Albany, OR | 27.1 | +0.5 h (+1.7%) |
| 153 | +25 | Toledo, OH | 27.1 | +1.3 h (+5.0%) |
| 154 | 0 | Rocky Mount, NC | 27.1 | +0.5 h (+2.1%) |
| 155 | +12 | Glens Falls, NY | 27.0 | +0.8 h (+3.0%) |
| 156 | -25 | Dubuque, IA | 27.0 | -0.5 h (-2.0%) |
| 157 | +32 | Grand Junction, CO | 27.0 | +1.7 h (+6.6%) |
| 158 | -32 | Yakima, WA | 27.0 | -0.8 h (-2.8%) |
| 159 | -23 | Anniston-Oxford, AL | 26.9 | -0.4 h (-1.5%) |
| 160 | -64 | Milwaukee-Waukesha, WI | 26.9 | -2.1 h (-7.3%) |
| 161 | +26 | Stockton-Lodi, CA | 26.8 | +1.5 h (+5.8%) |
| 162 | -46 | Racine-Mount Pleasant, WI | 26.8 | -1.2 h (-4.3%) |
| 163 | +17 | Altoona, PA | 26.8 | +1.1 h (+4.4%) |
| 164 | +30 | Lima, OH | 26.6 | +1.5 h (+5.9%) |
| 165 | +30 | Appleton, WI | 26.5 | +1.6 h (+6.2%) |
| 166 | -66 | Walla Walla, WA | 26.4 | -2.3 h (-7.9%) |
| 167 | -19 | Shreveport-Bossier City, LA | 26.4 | -0.4 h (-1.5%) |
| 168 | -35 | Casper, WY | 26.4 | -1.1 h (-4.1%) |
| 169 | +3 | Eagle Pass, TX | 26.3 | +0.2 h (+0.9%) |
| 170 | +14 | Bismarck, ND | 26.2 | +0.8 h (+3.1%) |
| 171 | -19 | Michigan City-La Porte, IN | 26.2 | -0.4 h (-1.5%) |
| 172 | -44 | Enid, OK | 26.1 | -1.5 h (-5.5%) |
| 173 | +26 | Sheboygan, WI | 26.0 | +1.6 h (+6.7%) |
| 174 | +7 | Las Cruces, NM | 26.0 | +0.4 h (+1.7%) |
| 175 | +4 | Farmington, NM | 25.9 | +0.1 h (+0.3%) |
| 176 | +15 | Grand Forks, ND-MN | 25.9 | +0.6 h (+2.5%) |
| 177 | -36 | Janesville-Beloit, WI | 25.8 | -1.4 h (-5.1%) |
| 178 | +32 | Peoria, IL | 25.8 | +2.1 h (+8.7%) |
| 179 | -36 | Grants Pass, OR | 25.8 | -1.4 h (-5.1%) |
| 180 | +5 | Muncie, IN | 25.7 | +0.3 h (+1.2%) |
| 181 | +16 | Fargo, ND-MN | 25.6 | +0.8 h (+3.1%) |
| 182 | -19 | McAllen-Edinburg-Mission, TX | 25.6 | -0.7 h (-2.6%) |
| 183 | +25 | Utica-Rome, NY | 25.6 | +1.6 h (+6.6%) |
| 184 | +19 | Canton-Massillon, OH | 25.6 | +1.3 h (+5.4%) |
| 185 | -20 | Alexandria, LA | 25.5 | -0.8 h (-3.1%) |
| 186 | +21 | Kokomo, IN | 25.4 | +1.4 h (+5.9%) |
| 187 | +15 | Wheeling, WV-OH | 25.4 | +1.0 h (+4.0%) |
| 188 | -29 | Gadsden, AL | 25.2 | -1.2 h (-4.7%) |
| 189 | +1 | Oshkosh-Neenah, WI | 25.1 | -0.2 h (-0.7%) |
| 190 | +14 | Cheyenne, WY | 25.1 | +0.9 h (+3.8%) |
| 191 | -3 | Topeka, KS | 25.0 | -0.3 h (-1.1%) |
| 192 | +6 | Redding, CA | 25.0 | +0.2 h (+0.9%) |
| 193 | -79 | Elkhart-Goshen, IN | 24.9 | -3.2 h (-11.5%) |
| 194 | -23 | Williamsport, PA | 24.8 | -1.3 h (-5.2%) |
| 195 | +5 | Cape Girardeau, MO-IL | 24.8 | +0.4 h (+1.6%) |
| 196 | 0 | Vallejo, CA | 24.8 | -0.2 h (-0.7%) |
| 197 | -11 | Buffalo-Cheektowaga, NY | 24.7 | -0.7 h (-2.6%) |
| 198 | -51 | Wausau, WI | 24.6 | -2.3 h (-8.5%) |
| 199 | -16 | Parkersburg-Vienna, WV | 24.6 | -0.9 h (-3.6%) |
| 200 | +29 | Modesto, CA | 24.6 | +5.8 h (+31.0%) |
| 201 | -80 | Duluth, MN-WI | 24.5 | -3.3 h (-12.0%) |
| 202 | +23 | Salem, OR | 24.4 | +2.6 h (+12.0%) |
| 203 | -45 | Brownsville-Harlingen, TX | 24.3 | -2.2 h (-8.1%) |
| 204 | -51 | Eau Claire, WI | 24.3 | -2.2 h (-8.4%) |
| 205 | 0 | Binghamton, NY | 24.3 | +0.2 h (+0.8%) |
| 206 | +6 | Weirton-Steubenville, WV-OH | 24.2 | +0.7 h (+3.2%) |
| 207 | +20 | Chico, CA | 23.9 | +3.0 h (+14.2%) |
| 208 | +5 | Decatur, IL | 23.9 | +0.5 h (+2.3%) |
| 209 | +5 | Merced, CA | 23.8 | +0.6 h (+2.4%) |
| 210 | -35 | Medford, OR | 23.8 | -2.1 h (-8.0%) |
| 211 | -37 | Fond du Lac, WI | 23.8 | -2.2 h (-8.5%) |
| 212 | +8 | Visalia, CA | 23.7 | +1.3 h (+5.6%) |
| 213 | -7 | Fort Smith, AR-OK | 23.7 | -0.4 h (-1.5%) |
| 214 | +2 | Mansfield, OH | 23.6 | +0.8 h (+3.6%) |
| 215 | +6 | Mankato, MN | 23.6 | +1.4 h (+6.2%) |
| 216 | +8 | Hanford-Corcoran, CA | 23.5 | +1.6 h (+7.5%) |
| 217 | -6 | Youngstown-Warren, OH | 23.4 | -0.2 h (-0.9%) |
| 218 | 0 | Battle Creek, MI | 23.2 | +0.7 h (+3.1%) |
| 219 | +4 | Johnstown, PA | 23.0 | +0.9 h (+4.2%) |
| 220 | -5 | St. Cloud, MN | 22.7 | -0.4 h (-1.7%) |
| 221 | -20 | Saginaw, MI | 22.7 | -1.7 h (-6.9%) |
| 222 | +6 | Bakersfield-Delano, CA | 22.3 | +1.8 h (+8.6%) |
| 223 | +3 | Yuba City, CA | 21.2 | +0.1 h (+0.6%) |
| 224 | -31 | Flint, MI | 21.0 | -4.2 h (-16.6%) |
Historical metro rankings, rents and wages.
Which metros qualify?
We ranked 224 of 387 metros where a published median RN wage and a single HUD two-bedroom rent covered the same area. In 146 metros, the wage area spanned several rent areas. For example, BLS reports one wage for Los Angeles and Orange counties together, while HUD sets a separate rent for each county.
In six other metros, the rent area extended beyond the wage area. The boundaries matched in the remaining 11, but BLS withheld seven median wages and listed no RN estimate for four.
How NurseRecruiter calculated the ranking
The pay-share scenario divides twelve months of rent by 2,080 paid hours at the local median wage. It assumes 40 hours each week for 52 weeks. It excludes taxes and other household costs. At fewer paid hours, the percentage rises. Annual changes subtract unrounded ratios from the previous calendar year; blank is unavailable, never zero. Adjacent OEWS estimates share survey panels and do not track the same workers. Census raised its rent-processing ceiling beginning in 2024, which warrants care across that break. No standard 2020 ACS one-year edition is substituted.
For states, NurseRecruiter divides the American Community Survey’s 2025 median monthly gross rent for an occupied two-bedroom unit paying cash rent by the May 2025 median hourly RN wage for that state or D.C. The national figure uses national rent and wage estimates directly. The rent estimate covers households paying rent, regardless of whether a nurse lives there.
For metros, we divide HUD’s monthly two-bedroom Fair Market Rent in effect in May 2025 by the local median hourly wage for registered nurses (BLS occupation 29-1141). HUD generally targets the 40th percentile of gross rent for standard-quality homes occupied by recent movers. BLS measures straight-time gross pay and excludes overtime pay and shift differentials.
We matched the counties, county equivalents and, where applicable, New England towns in the wage and rent areas. We applied HUD’s April 28, 2025 revisions. Two HUD areas with the same rent remain separate geographies.
The current ranking orders unrounded ratios from most to fewest hours and displays one decimal. Rank 1 means the largest rent-to-wage ratio. For an exact tie, the lower monthly rent ranks first. Dubuque, Iowa (#156), and Grand Junction, Colorado (#157), have the same unrounded ratio. Their two-bedroom rent benchmarks are $996 and $1,245. Markets with identical ratios and rents share a rank.
The midpoint and distribution describe the 224 eligible markets, giving each metro equal weight. BLS released the May 2025 wage data on May 15, 2026.
For wage comparisons and offer terms, see the Nursing Pay Atlas and How to Compare RN Pay Offers.
Study citation · NurseRecruiter, Rent in RN Hours, 2025 state and metro rankings, November 2026. State data · Metro data
Compare RN wages with taxes, housing costs and health insurance premiums.
Citing this study
Credit the rankings and comparisons to NurseRecruiter’s Rent in RN Hours, 2025 edition, and link to this article. Underlying data: BLS May 2025 RN wages, Census 2025 ACS two-bedroom gross rents for states, and HUD FY 2025 two-bedroom Fair Market Rents for metros. Identify the year when citing an earlier edition.
Sources
-
U.S. Bureau of Labor Statistics, May 2025 metropolitan occupational employment and wage estimates (accessed 2026-11-20). RN occupation 29-1141, hourly median and 25th and 75th percentiles.
-
U.S. Department of Housing and Urban Development, FY 2025 Fair Market Rents, metropolitan and nonmetropolitan schedules (accessed 2026-11-20). Monthly gross rent benchmark for a two-bedroom unit.
-
HUD, revised FY 2025 Fair Market Rents effective April 28, 2025 (accessed 2026-11-20). Use revised values where they were in effect in May.
-
BLS, metropolitan area definitions for May 2025 (accessed 2026-11-20). County or county-equivalent coverage of each wage area.
-
BLS, Occupational Employment and Wages, May 2025, released May 15, 2026 (accessed 2026-11-20). Publication date for the wage estimates.
-
HUD, FY 2025 Fair Market Rent Schedule B (accessed 2026-11-20). Metro, county and subcounty coverage and original two-bedroom rents. Apply the April 28 revisions above.
-
U.S. Census Bureau, metropolitan and micropolitan delineation files (accessed 2026-11-20). July 2023 delineations, cross-checked against the May 2025 BLS metro definitions.
-
HUD, FY 2025 Fair Market Rent notice and methodology (accessed 2026-11-20). Defines the rent benchmark and the geography used for the fiscal-year schedule.
-
U.S. Census Bureau, 2025 ACS one-year median gross rent by bedrooms, table B25031 (accessed 2026-11-20). Two-bedroom rent estimates and their 90% margins of error for each state, D.C. and the U.S.
-
U.S. Census Bureau, 2025 ACS subject definitions (accessed 2026-11-20). Gross rent, utilities and rental-household coverage.
-
U.S. Bureau of Labor Statistics, May 2025 state occupational wage files (accessed 2026-11-20). Median hourly RN wages, occupation 29-1141.
-
U.S. Bureau of Labor Statistics, May 2025 national occupational wage file (accessed 2026-11-20). National hourly RN median.
-
U.S. Census Bureau, 2024 metro reference locations (accessed 2026-11-20). Map reference points for the 387 BLS metro markets.
-
U.S. Census Bureau, 2024 generalized state boundaries (accessed 2026-11-20). State outlines and map insets.
-
BLS, Occupational Employment and Wage Statistics, wage definitions, section D.3 (accessed 2026-11-20). Straight-time wage reporting and excluded premium payments.
-
U.S. Census Bureau, 2024 ACS one-year median gross rent by bedrooms, table B25031 (accessed 2026-11-20). Preserved original file used for the annual comparison.
-
BLS, May 2024 state occupational wage files (accessed 2026-11-20). Preserved original RN median hourly wage inputs.
-
BLS, May 2024 metro occupational wage files (accessed 2026-11-20). Preserved original RN median hourly wage inputs.
-
HUD, FY 2024 Fair Market Rent schedule (accessed 2026-11-20). Prior-year rents, with revisions in force in May.
-
HUD, revised FY 2024 rent for Urban Honolulu effective March 11, 2024 (accessed 2026-11-20). Revision used in the preserved prior-year edition.
-
U.S. Census Bureau, change to monthly contract-rent estimates beginning in 2024 (accessed 2026-11-20). Rent-processing ceiling change and limits on historical comparisons.