
In 2022, a month’s rent for a two-bedroom home took 40.9 hours of median RN pay in Florida and 42.5 hours in Colorado. By 2025, Florida took 46.3 hours and Colorado 39.4. The U.S. benchmark stayed close to 33 hours.
National benchmarks and annual rankings
Rank 1 is the state or D.C. where a month’s two-bedroom rent took the most hours of gross RN pay. The U.S. benchmark uses national rent and pay estimates. The ± figure in each state table is the Census Bureau’s 90% margin of error for monthly rent. See Rent in RN Hours for the current comparison.
| Edition and state rankings | U.S. gross RN hours | U.S. Census median two-bedroom gross rent/month | U.S. RN pay per hour |
|---|---|---|---|
| 2025 | 33.3 | $1,563 ±$5 | $46.90 |
| 2024 | 33.1 | $1,490 ±$5 | $45.00 |
| 2023 | 33.9 | $1,401 ±$4 | $41.38 |
| 2022 | 33.1 | $1,294 ±$4 | $39.05 |
| 2021 | 31.8 | $1,185 ±$3 | $37.31 |
| 2019 | 30.8 | $1,086 ±$3 | $35.24 |
| 2018 | 30.3 | $1,044 ±$3 | $34.48 |
| 2017 | 29.5 | $991 ±$3 | $33.65 |
| 2016 | 29.3 | $963 ±$2 | $32.91 |
| 2015 | 29.0 | $941 ±$2 | $32.45 |
Why 2020 is missing. Pandemic disruptions prevented the Census Bureau from issuing the standard 2020 one-year American Community Survey (ACS) estimates. Its experimental release has different weights and coverage. Census first published the two-bedroom median gross rent table used here in 2015.
Why Florida and Colorado changed places
Florida’s Census median two-bedroom gross rent rose from $1,528 in 2022 to $1,873 in 2025, a 22.6% increase. Median RN pay rose from $37.36 to $40.48 an hour, or 8.4%. In Colorado, rent rose from $1,683 to $1,900 (12.9%), while RN pay went from $39.63 to $48.20 an hour (21.6%). RN pay outpaced rent in Colorado. In Florida, rent grew faster.
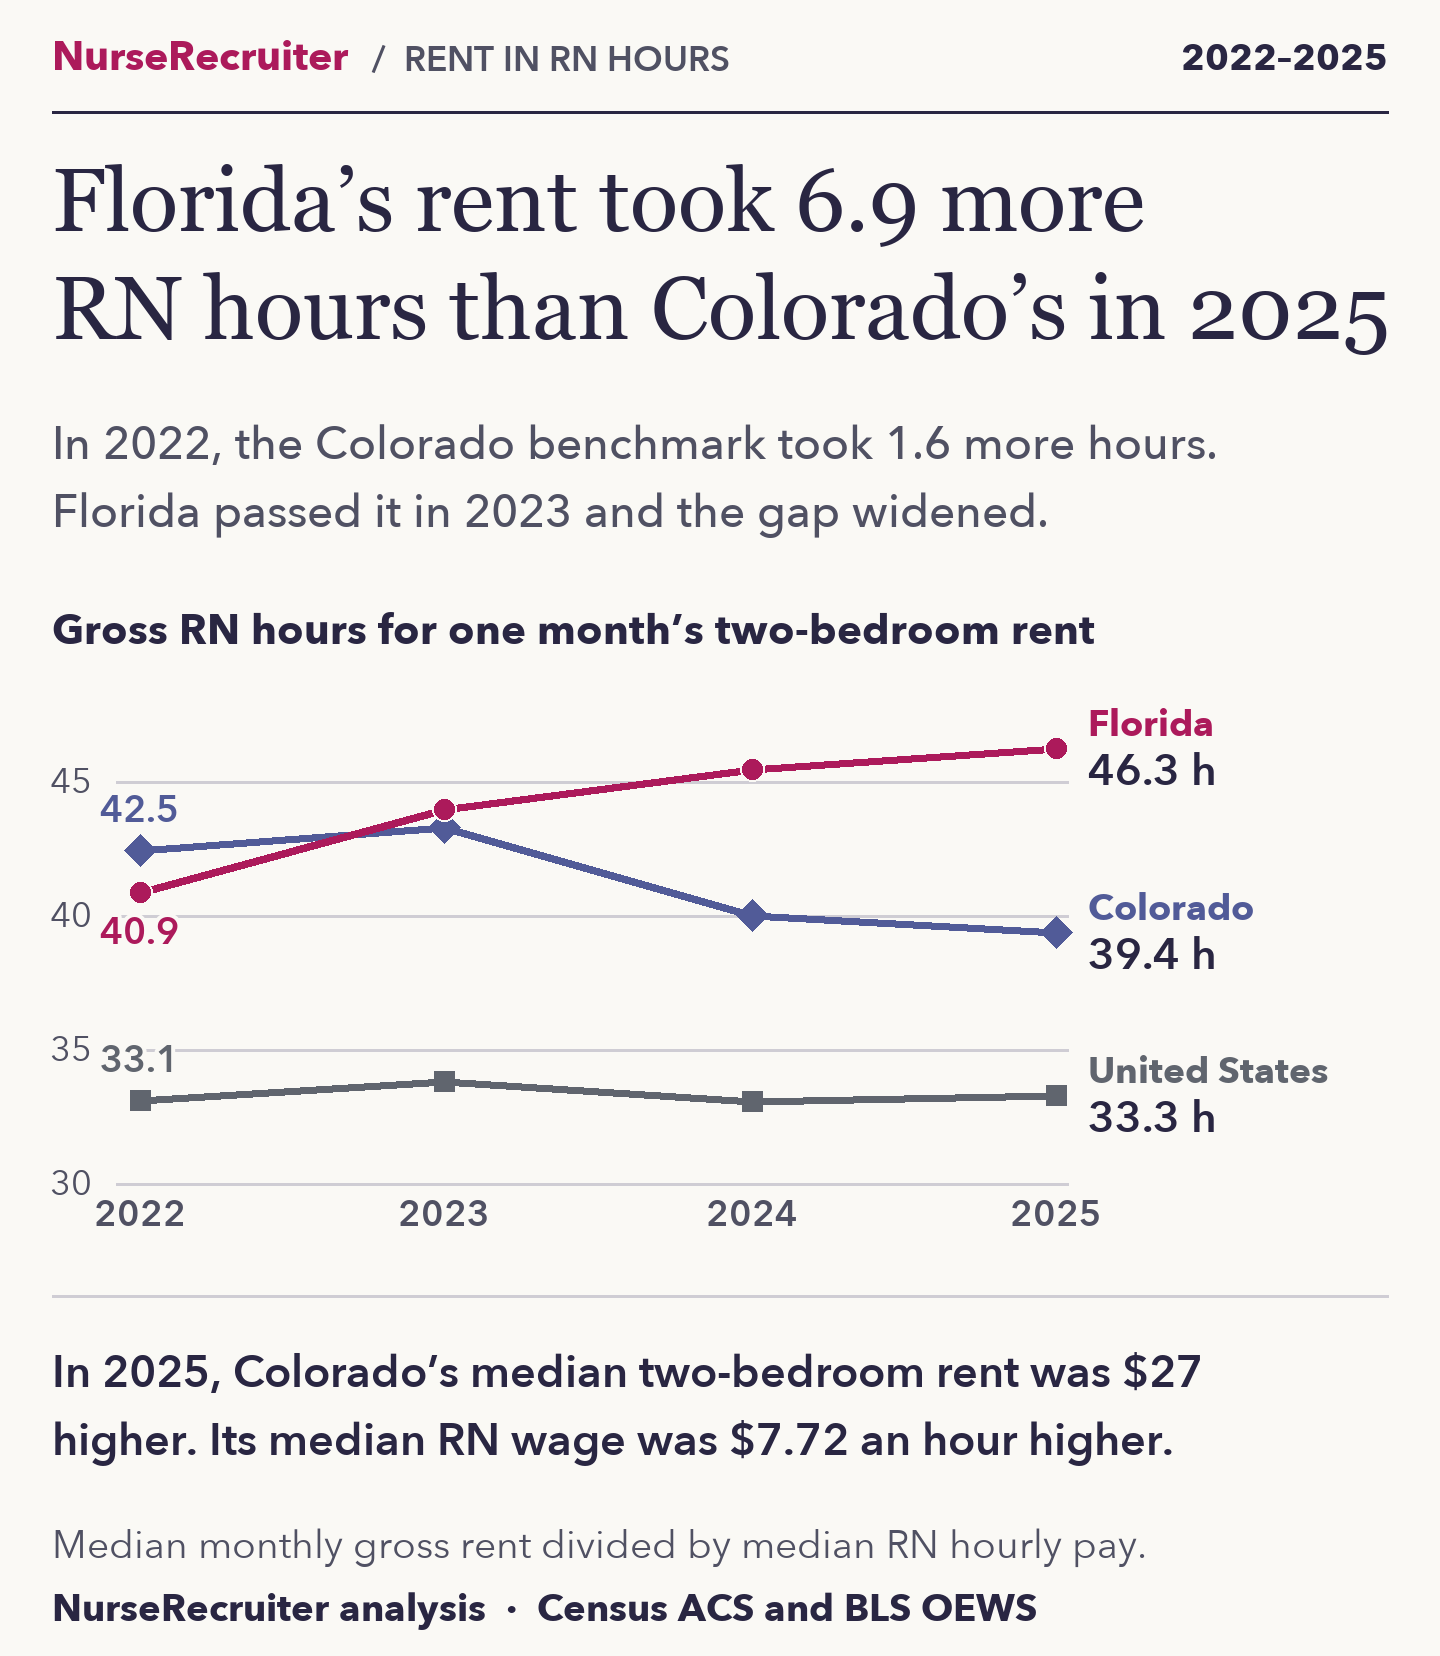
In 2025 Colorado’s Census median two-bedroom gross rent was $27 higher than Florida’s. Its median RN wage was $7.72 higher per hour.
2025 state rankings
D.C. ranked first at 51.5 hours. Rent took the fewest hours in West Virginia, at 23.6. The U.S. benchmark was 33.3 hours. The 2025 Census rent table gives the monthly rent and margin of error for each state. See the 2025 state comparison in the main study for the visual ranking.
| Rank | State or D.C. | Gross RN hours | Census median two-bedroom gross rent/month ± margin | Median RN pay per hour |
|---|---|---|---|---|
| 1 | District of Columbia | 51.5 | $2,541 ±$187 | $49.30 |
| 2 | Florida | 46.3 | $1,873 ±$16 | $40.48 |
| 3 | Massachusetts | 42.2 | $2,121 ±$44 | $50.27 |
| 4 | Colorado | 39.4 | $1,900 ±$32 | $48.20 |
| 5 | New Hampshire | 39.0 | $1,867 ±$52 | $47.93 |
| 6 | New Jersey | 38.9 | $1,990 ±$29 | $51.20 |
| 7 | Utah | 38.8 | $1,579 ±$33 | $40.67 |
| 8 | Maryland | 38.2 | $1,834 ±$26 | $47.98 |
| 9 | Virginia | 37.2 | $1,673 ±$30 | $45.00 |
| 10 | Connecticut | 35.9 | $1,772 ±$36 | $49.39 |
| 11 | Arizona | 35.5 | $1,699 ±$22 | $47.84 |
| 12 | Rhode Island | 35.2 | $1,701 ±$68 | $48.39 |
| 13 | Maine | 34.3 | $1,433 ±$68 | $41.82 |
| 14 | Delaware | 34.1 | $1,632 ±$57 | $47.85 |
| 15 | Georgia | 33.9 | $1,524 ±$25 | $44.98 |
| 16 | South Carolina | 33.8 | $1,338 ±$30 | $39.60 |
| 17 | Tennessee | 33.3 | $1,306 ±$28 | $39.18 |
| 18 | Texas | 33.2 | $1,533 ±$16 | $46.14 |
| 19 | California | 33.2 | $2,239 ±$14 | $67.44 |
| 20 | North Carolina | 33.2 | $1,346 ±$21 | $40.56 |
| 21 | Nevada | 33.0 | $1,644 ±$27 | $49.84 |
| 22 | New York | 32.9 | $1,729 ±$22 | $52.62 |
| 23 | Idaho | 32.4 | $1,438 ±$45 | $44.45 |
| 24 | Washington | 31.6 | $1,885 ±$21 | $59.71 |
| 25 | Montana | 31.2 | $1,281 ±$68 | $41.00 |
| 26 | Vermont | 31.0 | $1,452 ±$113 | $46.86 |
| 27 | Illinois | 30.7 | $1,416 ±$28 | $46.15 |
| 28 | Hawaii | 30.7 | $2,010 ±$71 | $65.54 |
| 29 | South Dakota | 30.6 | $1,148 ±$38 | $37.53 |
| 30 | Indiana | 30.3 | $1,218 ±$18 | $40.14 |
| 31 | Ohio | 30.0 | $1,190 ±$12 | $39.67 |
| 32 | Alabama | 29.8 | $1,103 ±$23 | $37.06 |
| 33 | Minnesota | 29.6 | $1,443 ±$24 | $48.80 |
| 34 | Nebraska | 29.3 | $1,194 ±$30 | $40.74 |
| 35 | Kansas | 29.3 | $1,116 ±$20 | $38.14 |
| 36 | Pennsylvania | 29.2 | $1,353 ±$22 | $46.36 |
| 37 | Louisiana | 28.6 | $1,105 ±$18 | $38.57 |
| 38 | Alaska | 28.6 | $1,506 ±$73 | $52.64 |
| 39 | Missouri | 28.5 | $1,121 ±$18 | $39.32 |
| 40 | Michigan | 28.2 | $1,280 ±$17 | $45.34 |
| 41 | Kentucky | 28.0 | $1,089 ±$23 | $38.96 |
| 42 | Iowa | 27.8 | $1,049 ±$24 | $37.80 |
| 43 | North Dakota | 27.7 | $1,076 ±$44 | $38.81 |
| 44 | Mississippi | 27.4 | $1,016 ±$47 | $37.06 |
| 45 | Oklahoma | 27.2 | $1,085 ±$18 | $39.87 |
| 46 | Wisconsin | 26.9 | $1,236 ±$16 | $45.93 |
| 47 | Arkansas | 26.7 | $1,014 ±$29 | $37.95 |
| 48 | Oregon | 26.6 | $1,650 ±$23 | $62.02 |
| 49 | Wyoming | 25.7 | $1,035 ±$59 | $40.27 |
| 50 | New Mexico | 25.0 | $1,133 ±$37 | $45.36 |
| 51 | West Virginia | 23.6 | $909 ±$30 | $38.52 |
2024 state rankings
D.C. ranked first at 47.1 hours. Rent took the fewest hours in West Virginia, at 23.6. The U.S. benchmark was 33.1 hours. The 2024 Census rent table gives the monthly rent and margin of error for each state.
| Rank | State or D.C. | Gross RN hours | Census median two-bedroom gross rent/month ± margin | Median RN pay per hour |
|---|---|---|---|---|
| 1 | District of Columbia | 47.1 | $2,366 ±$164 | $50.27 |
| 2 | Florida | 45.5 | $1,812 ±$12 | $39.83 |
| 3 | Colorado | 40.0 | $1,857 ±$28 | $46.40 |
| 4 | Massachusetts | 40.0 | $1,962 ±$33 | $49.03 |
| 5 | Utah | 39.1 | $1,545 ±$44 | $39.55 |
| 6 | New Jersey | 38.2 | $1,885 ±$25 | $49.39 |
| 7 | Maryland | 37.8 | $1,758 ±$22 | $46.55 |
| 8 | Vermont | 36.9 | $1,509 ±$103 | $40.94 |
| 9 | Virginia | 36.4 | $1,555 ±$24 | $42.70 |
| 10 | New Hampshire | 36.2 | $1,687 ±$43 | $46.55 |
| 11 | Arizona | 35.4 | $1,649 ±$25 | $46.58 |
| 12 | Delaware | 35.1 | $1,564 ±$56 | $44.53 |
| 13 | Georgia | 35.1 | $1,459 ±$25 | $41.61 |
| 14 | Texas | 34.1 | $1,475 ±$15 | $43.27 |
| 15 | Washington | 34.1 | $1,837 ±$21 | $53.93 |
| 16 | Connecticut | 33.9 | $1,658 ±$32 | $48.84 |
| 17 | Rhode Island | 33.8 | $1,624 ±$63 | $48.06 |
| 18 | Nevada | 33.6 | $1,646 ±$24 | $49.03 |
| 19 | Maine | 33.3 | $1,325 ±$52 | $39.84 |
| 20 | South Carolina | 33.2 | $1,275 ±$41 | $38.41 |
| 21 | North Carolina | 32.4 | $1,277 ±$25 | $39.36 |
| 22 | California | 32.3 | $2,179 ±$13 | $67.47 |
| 23 | Tennessee | 32.2 | $1,225 ±$21 | $38.00 |
| 24 | New York | 32.2 | $1,634 ±$22 | $50.77 |
| 25 | Illinois | 32.1 | $1,333 ±$16 | $41.54 |
| 26 | South Dakota | 32.0 | $1,071 ±$41 | $33.42 |
| 27 | Montana | 31.5 | $1,234 ±$65 | $39.21 |
| 28 | Pennsylvania | 31.0 | $1,307 ±$19 | $42.12 |
| 29 | Idaho | 30.8 | $1,275 ±$44 | $41.39 |
| 30 | Alabama | 30.7 | $1,048 ±$24 | $34.16 |
| 31 | Hawaii | 29.8 | $1,953 ±$65 | $65.54 |
| 32 | Indiana | 29.2 | $1,132 ±$14 | $38.82 |
| 33 | Michigan | 29.1 | $1,200 ±$15 | $41.19 |
| 34 | Kansas | 28.8 | $1,082 ±$25 | $37.53 |
| 35 | Ohio | 28.7 | $1,122 ±$11 | $39.06 |
| 36 | Minnesota | 28.2 | $1,369 ±$22 | $48.50 |
| 37 | Nebraska | 28.0 | $1,092 ±$28 | $38.95 |
| 38 | Wisconsin | 27.8 | $1,149 ±$11 | $41.38 |
| 39 | Missouri | 27.6 | $1,057 ±$18 | $38.35 |
| 40 | Louisiana | 27.5 | $1,041 ±$23 | $37.92 |
| 41 | Alaska | 27.3 | $1,453 ±$60 | $53.22 |
| 42 | Oregon | 27.2 | $1,620 ±$21 | $59.61 |
| 43 | Iowa | 27.1 | $1,003 ±$19 | $37.00 |
| 44 | Mississippi | 26.9 | $963 ±$21 | $35.80 |
| 45 | Oklahoma | 26.4 | $1,032 ±$18 | $39.02 |
| 46 | Kentucky | 26.2 | $1,006 ±$27 | $38.42 |
| 47 | New Mexico | 26.0 | $1,104 ±$33 | $42.43 |
| 48 | North Dakota | 25.3 | $950 ±$38 | $37.62 |
| 49 | Arkansas | 25.2 | $934 ±$16 | $37.08 |
| 50 | Wyoming | 24.7 | $972 ±$34 | $39.32 |
| 51 | West Virginia | 23.6 | $906 ±$22 | $38.46 |
2023 state rankings
Florida ranked first at 44.0 hours. Rent took the fewest hours in West Virginia, at 22.7. The U.S. benchmark was 33.9 hours.
| Rank | State or D.C. | Gross RN hours | Census median two-bedroom gross rent/month ± margin | Median RN pay per hour |
|---|---|---|---|---|
| 1 | Florida | 44.0 | $1,712 ±$14 | $38.92 |
| 2 | Colorado | 43.3 | $1,810 ±$29 | $41.78 |
| 3 | New Hampshire | 40.1 | $1,670 ±$42 | $41.65 |
| 4 | Massachusetts | 39.2 | $1,882 ±$34 | $47.95 |
| 5 | Maryland | 39.1 | $1,679 ±$25 | $42.95 |
| 6 | District of Columbia | 38.9 | $1,966 ±$140 | $50.59 |
| 7 | Arizona | 38.2 | $1,623 ±$23 | $42.46 |
| 8 | Utah | 38.1 | $1,460 ±$39 | $38.36 |
| 9 | Virginia | 37.2 | $1,503 ±$31 | $40.43 |
| 10 | New Jersey | 36.4 | $1,755 ±$19 | $48.15 |
| 11 | Texas | 34.1 | $1,396 ±$11 | $40.92 |
| 12 | Nevada | 34.1 | $1,575 ±$28 | $46.25 |
| 13 | Vermont | 34.0 | $1,337 ±$76 | $39.37 |
| 14 | Washington | 33.8 | $1,752 ±$20 | $51.79 |
| 15 | Georgia | 33.1 | $1,331 ±$28 | $40.20 |
| 16 | Maine | 32.4 | $1,271 ±$68 | $39.24 |
| 17 | California | 32.0 | $2,062 ±$14 | $64.42 |
| 18 | Connecticut | 31.7 | $1,535 ±$32 | $48.37 |
| 19 | Hawaii | 31.6 | $1,966 ±$66 | $62.12 |
| 20 | Illinois | 31.6 | $1,254 ±$17 | $39.65 |
| 21 | Tennessee | 31.5 | $1,154 ±$20 | $36.64 |
| 22 | Rhode Island | 31.4 | $1,431 ±$40 | $45.60 |
| 23 | North Carolina | 31.3 | $1,199 ±$20 | $38.26 |
| 24 | New York | 30.9 | $1,556 ±$21 | $50.28 |
| 25 | Pennsylvania | 30.8 | $1,226 ±$16 | $39.80 |
| 26 | Idaho | 30.7 | $1,183 ±$29 | $38.53 |
| 27 | South Carolina | 30.5 | $1,148 ±$27 | $37.68 |
| 28 | Delaware | 29.9 | $1,340 ±$59 | $44.81 |
| 29 | Alabama | 29.5 | $935 ±$23 | $31.68 |
| 30 | South Dakota | 29.5 | $951 ±$25 | $32.23 |
| 31 | Michigan | 29.2 | $1,148 ±$12 | $39.28 |
| 32 | Montana | 29.0 | $1,105 ±$41 | $38.06 |
| 33 | Minnesota | 28.3 | $1,326 ±$26 | $46.78 |
| 34 | Kansas | 28.3 | $1,030 ±$19 | $36.43 |
| 35 | Nebraska | 28.2 | $1,059 ±$28 | $37.55 |
| 36 | Alaska | 28.1 | $1,439 ±$49 | $51.16 |
| 37 | Indiana | 28.1 | $1,061 ±$18 | $37.76 |
| 38 | Oregon | 27.9 | $1,490 ±$25 | $53.34 |
| 39 | Iowa | 27.9 | $959 ±$12 | $34.41 |
| 40 | Louisiana | 27.5 | $1,013 ±$23 | $36.85 |
| 41 | Wisconsin | 27.1 | $1,086 ±$12 | $40.05 |
| 42 | Ohio | 27.0 | $1,036 ±$14 | $38.44 |
| 43 | Missouri | 26.8 | $996 ±$15 | $37.11 |
| 44 | Oklahoma | 26.4 | $998 ±$15 | $37.87 |
| 45 | New Mexico | 26.1 | $1,055 ±$46 | $40.37 |
| 46 | Mississippi | 25.8 | $859 ±$19 | $33.35 |
| 47 | Arkansas | 25.6 | $897 ±$16 | $35.06 |
| 48 | North Dakota | 25.4 | $916 ±$32 | $36.03 |
| 49 | Kentucky | 24.5 | $917 ±$16 | $37.42 |
| 50 | Wyoming | 24.0 | $922 ±$35 | $38.45 |
| 51 | West Virginia | 22.7 | $858 ±$18 | $37.85 |
2022 state rankings
Colorado ranked first at 42.5 hours. Rent took the fewest hours in West Virginia, at 22.8. The U.S. benchmark was 33.1 hours.
| Rank | State or D.C. | Gross RN hours | Census median two-bedroom gross rent/month ± margin | Median RN pay per hour |
|---|---|---|---|---|
| 1 | Colorado | 42.5 | $1,683 ±$23 | $39.63 |
| 2 | District of Columbia | 41.6 | $1,979 ±$157 | $47.58 |
| 3 | Florida | 40.9 | $1,528 ±$18 | $37.36 |
| 4 | Maryland | 39.7 | $1,600 ±$25 | $40.31 |
| 5 | New Hampshire | 39.1 | $1,515 ±$47 | $38.73 |
| 6 | Arizona | 36.5 | $1,445 ±$30 | $39.58 |
| 7 | Massachusetts | 36.5 | $1,727 ±$29 | $47.37 |
| 8 | Virginia | 35.6 | $1,364 ±$23 | $38.32 |
| 9 | New Jersey | 35.2 | $1,658 ±$21 | $47.16 |
| 10 | Utah | 34.4 | $1,277 ±$31 | $37.14 |
| 11 | Vermont | 33.4 | $1,241 ±$68 | $37.13 |
| 12 | Washington | 33.3 | $1,623 ±$21 | $48.67 |
| 13 | Tennessee | 33.3 | $1,054 ±$18 | $31.63 |
| 14 | Texas | 33.1 | $1,272 ±$13 | $38.38 |
| 15 | Rhode Island | 32.2 | $1,331 ±$49 | $41.33 |
| 16 | Hawaii | 32.0 | $1,848 ±$54 | $57.74 |
| 17 | Delaware | 31.9 | $1,261 ±$53 | $39.54 |
| 18 | Georgia | 31.8 | $1,215 ±$20 | $38.19 |
| 19 | Illinois | 31.5 | $1,197 ±$14 | $37.97 |
| 20 | Minnesota | 31.5 | $1,273 ±$23 | $40.41 |
| 21 | Connecticut | 31.5 | $1,441 ±$30 | $45.77 |
| 22 | New York | 31.1 | $1,502 ±$20 | $48.26 |
| 23 | Nevada | 30.8 | $1,405 ±$21 | $45.64 |
| 24 | Pennsylvania | 30.6 | $1,157 ±$15 | $37.86 |
| 25 | California | 30.2 | $1,926 ±$12 | $63.78 |
| 26 | Kansas | 30.0 | $957 ±$17 | $31.95 |
| 27 | Maine | 29.9 | $1,113 ±$36 | $37.18 |
| 28 | South Dakota | 29.7 | $899 ±$36 | $30.25 |
| 29 | Iowa | 29.2 | $914 ±$17 | $31.25 |
| 30 | North Carolina | 29.0 | $1,065 ±$18 | $36.75 |
| 31 | South Carolina | 28.8 | $1,048 ±$27 | $36.35 |
| 32 | Michigan | 28.6 | $1,089 ±$14 | $38.07 |
| 33 | Montana | 28.3 | $1,040 ±$33 | $36.80 |
| 34 | Alabama | 27.9 | $846 ±$21 | $30.33 |
| 35 | Idaho | 27.9 | $1,045 ±$35 | $37.47 |
| 36 | Indiana | 27.8 | $979 ±$11 | $35.24 |
| 37 | Louisiana | 27.6 | $971 ±$20 | $35.18 |
| 38 | Missouri | 27.5 | $944 ±$13 | $34.35 |
| 39 | Alaska | 27.5 | $1,351 ±$30 | $49.16 |
| 40 | Nebraska | 27.1 | $977 ±$24 | $36.05 |
| 41 | Mississippi | 27.0 | $821 ±$24 | $30.45 |
| 42 | Arkansas | 27.0 | $831 ±$14 | $30.83 |
| 43 | Oregon | 26.6 | $1,363 ±$20 | $51.29 |
| 44 | Ohio | 26.5 | $977 ±$10 | $36.93 |
| 45 | Wisconsin | 26.4 | $1,011 ±$16 | $38.34 |
| 46 | North Dakota | 26.0 | $870 ±$29 | $33.48 |
| 47 | Oklahoma | 25.6 | $918 ±$12 | $35.83 |
| 48 | Kentucky | 24.5 | $893 ±$12 | $36.44 |
| 49 | New Mexico | 24.0 | $945 ±$25 | $39.42 |
| 50 | Wyoming | 23.8 | $888 ±$25 | $37.37 |
| 51 | West Virginia | 22.8 | $814 ±$21 | $35.65 |
2021 state rankings
Maryland ranked first at 40.5 hours. Rent took the fewest hours in Wyoming, at 23.4. The U.S. benchmark was 31.8 hours.
| Rank | State or D.C. | Gross RN hours | Census median two-bedroom gross rent/month ± margin | Median RN pay per hour |
|---|---|---|---|---|
| 1 | Maryland | 40.5 | $1,527 ±$26 | $37.67 |
| 2 | District of Columbia | 39.9 | $1,825 ±$123 | $45.78 |
| 3 | Colorado | 39.7 | $1,490 ±$21 | $37.53 |
| 4 | Florida | 37.5 | $1,352 ±$8 | $36.06 |
| 5 | New Hampshire | 37.4 | $1,387 ±$41 | $37.13 |
| 6 | Vermont | 35.1 | $1,271 ±$65 | $36.24 |
| 7 | New Jersey | 34.1 | $1,552 ±$19 | $45.53 |
| 8 | Massachusetts | 34.1 | $1,556 ±$28 | $45.65 |
| 9 | Virginia | 33.7 | $1,245 ±$21 | $36.97 |
| 10 | Connecticut | 33.6 | $1,355 ±$22 | $40.32 |
| 11 | Hawaii | 33.4 | $1,785 ±$44 | $53.40 |
| 12 | Arizona | 33.2 | $1,251 ±$20 | $37.63 |
| 13 | Nevada | 33.1 | $1,265 ±$18 | $38.16 |
| 14 | Rhode Island | 32.8 | $1,244 ±$49 | $37.93 |
| 15 | Delaware | 32.5 | $1,178 ±$42 | $36.24 |
| 16 | Utah | 32.4 | $1,167 ±$27 | $36.06 |
| 17 | Washington | 31.7 | $1,479 ±$22 | $46.63 |
| 18 | Tennessee | 31.5 | $944 ±$17 | $30.00 |
| 19 | Minnesota | 31.2 | $1,188 ±$18 | $38.03 |
| 20 | Texas | 31.1 | $1,155 ±$9 | $37.17 |
| 21 | Indiana | 30.7 | $921 ±$12 | $30.00 |
| 22 | New York | 30.5 | $1,410 ±$18 | $46.24 |
| 23 | Nebraska | 30.4 | $935 ±$15 | $30.77 |
| 24 | South Dakota | 30.3 | $883 ±$29 | $29.11 |
| 25 | Georgia | 30.1 | $1,086 ±$17 | $36.08 |
| 26 | Missouri | 29.9 | $890 ±$12 | $29.77 |
| 27 | Louisiana | 29.9 | $926 ±$18 | $30.99 |
| 28 | Kansas | 29.8 | $886 ±$13 | $29.71 |
| 29 | California | 29.8 | $1,797 ±$12 | $60.26 |
| 30 | Illinois | 29.7 | $1,107 ±$11 | $37.30 |
| 31 | Pennsylvania | 29.0 | $1,072 ±$13 | $36.99 |
| 32 | Iowa | 28.8 | $855 ±$11 | $29.71 |
| 33 | Alabama | 28.4 | $826 ±$16 | $29.09 |
| 34 | Oklahoma | 28.1 | $840 ±$9 | $29.89 |
| 35 | North Carolina | 28.0 | $973 ±$12 | $34.72 |
| 36 | Maine | 27.8 | $1,002 ±$42 | $36.08 |
| 37 | Kentucky | 27.7 | $831 ±$13 | $30.04 |
| 38 | Mississippi | 27.6 | $807 ±$18 | $29.23 |
| 39 | South Carolina | 27.1 | $946 ±$18 | $34.93 |
| 40 | Michigan | 26.9 | $993 ±$10 | $36.88 |
| 41 | Alaska | 26.3 | $1,254 ±$50 | $47.65 |
| 42 | Oregon | 26.2 | $1,253 ±$24 | $47.80 |
| 43 | Arkansas | 26.2 | $775 ±$18 | $29.58 |
| 44 | West Virginia | 26.1 | $784 ±$24 | $30.00 |
| 45 | Idaho | 25.8 | $936 ±$36 | $36.33 |
| 46 | Wisconsin | 25.5 | $938 ±$8 | $36.81 |
| 47 | Ohio | 25.0 | $890 ±$8 | $35.62 |
| 48 | New Mexico | 24.3 | $917 ±$30 | $37.66 |
| 49 | Montana | 24.1 | $870 ±$22 | $36.06 |
| 50 | North Dakota | 23.6 | $832 ±$28 | $35.22 |
| 51 | Wyoming | 23.4 | $843 ±$45 | $36.06 |
2019 state rankings
Florida ranked first at 39.2 hours. Rent took the fewest hours in New Mexico, at 23.3. The U.S. benchmark was 30.8 hours.
| Rank | State or D.C. | Gross RN hours | Census median two-bedroom gross rent/month ± margin | Median RN pay per hour |
|---|---|---|---|---|
| 1 | Florida | 39.2 | $1,240 ±$9 | $31.65 |
| 2 | Maryland | 38.6 | $1,424 ±$22 | $36.92 |
| 3 | Colorado | 38.5 | $1,391 ±$18 | $36.10 |
| 4 | New Hampshire | 36.4 | $1,273 ±$38 | $34.95 |
| 5 | District of Columbia | 36.2 | $1,594 ±$127 | $43.98 |
| 6 | New Jersey | 35.8 | $1,443 ±$13 | $40.35 |
| 7 | Massachusetts | 35.1 | $1,477 ±$25 | $42.09 |
| 8 | Vermont | 34.8 | $1,127 ±$66 | $32.39 |
| 9 | Virginia | 34.7 | $1,172 ±$20 | $33.77 |
| 10 | Utah | 33.6 | $1,055 ±$23 | $31.36 |
| 11 | Washington | 33.3 | $1,336 ±$21 | $40.14 |
| 12 | Hawaii | 32.3 | $1,719 ±$60 | $53.22 |
| 13 | Delaware | 31.8 | $1,112 ±$25 | $35.01 |
| 14 | New York | 31.4 | $1,320 ±$17 | $41.99 |
| 15 | Connecticut | 31.4 | $1,233 ±$18 | $39.24 |
| 16 | California | 31.1 | $1,655 ±$10 | $53.18 |
| 17 | Texas | 30.7 | $1,083 ±$8 | $35.29 |
| 18 | Illinois | 29.7 | $1,023 ±$13 | $34.43 |
| 19 | Georgia | 29.7 | $977 ±$12 | $32.89 |
| 20 | Tennessee | 29.4 | $866 ±$11 | $29.42 |
| 21 | Arizona | 29.3 | $1,083 ±$13 | $36.93 |
| 22 | Iowa | 28.9 | $826 ±$11 | $28.60 |
| 23 | South Carolina | 28.7 | $879 ±$14 | $30.65 |
| 24 | Minnesota | 28.6 | $1,082 ±$17 | $37.77 |
| 25 | Kansas | 28.6 | $837 ±$13 | $29.23 |
| 26 | Pennsylvania | 28.6 | $971 ±$12 | $33.91 |
| 27 | North Carolina | 28.3 | $878 ±$10 | $31.06 |
| 28 | Louisiana | 28.0 | $863 ±$13 | $30.79 |
| 29 | Alaska | 28.0 | $1,220 ±$46 | $43.54 |
| 30 | South Dakota | 28.0 | $790 ±$24 | $28.21 |
| 31 | Missouri | 27.6 | $829 ±$11 | $30.03 |
| 32 | Indiana | 27.5 | $843 ±$7 | $30.61 |
| 33 | Alabama | 27.5 | $777 ±$18 | $28.27 |
| 34 | Maine | 27.4 | $909 ±$32 | $33.14 |
| 35 | Rhode Island | 27.3 | $1,090 ±$35 | $39.97 |
| 36 | Nebraska | 27.2 | $850 ±$14 | $31.25 |
| 37 | Mississippi | 26.5 | $747 ±$17 | $28.17 |
| 38 | Nevada | 26.3 | $1,107 ±$15 | $42.02 |
| 39 | North Dakota | 26.2 | $815 ±$30 | $31.10 |
| 40 | Michigan | 26.1 | $906 ±$11 | $34.74 |
| 41 | Ohio | 26.1 | $824 ±$7 | $31.63 |
| 42 | Montana | 26.0 | $849 ±$22 | $32.65 |
| 43 | Oregon | 25.9 | $1,164 ±$16 | $44.89 |
| 44 | Oklahoma | 25.9 | $793 ±$9 | $30.60 |
| 45 | Wisconsin | 25.6 | $881 ±$7 | $34.40 |
| 46 | Kentucky | 25.4 | $760 ±$13 | $29.89 |
| 47 | Idaho | 25.3 | $843 ±$20 | $33.33 |
| 48 | Wyoming | 25.1 | $800 ±$30 | $31.87 |
| 49 | West Virginia | 25.0 | $739 ±$16 | $29.55 |
| 50 | Arkansas | 24.6 | $714 ±$12 | $29.01 |
| 51 | New Mexico | 23.3 | $819 ±$19 | $35.18 |
2018 state rankings
Maryland ranked first at 38.3 hours. Rent took the fewest hours in New Mexico, at 23.5. The U.S. benchmark was 30.3 hours.
| Rank | State or D.C. | Gross RN hours | Census median two-bedroom gross rent/month ± margin | Median RN pay per hour |
|---|---|---|---|---|
| 1 | Maryland | 38.3 | $1,392 ±$17 | $36.38 |
| 2 | Florida | 38.0 | $1,176 ±$7 | $30.96 |
| 3 | Colorado | 37.2 | $1,302 ±$18 | $35.03 |
| 4 | New Jersey | 36.0 | $1,418 ±$13 | $39.34 |
| 5 | Vermont | 35.8 | $1,131 ±$47 | $31.61 |
| 6 | New Hampshire | 34.5 | $1,189 ±$28 | $34.44 |
| 7 | Virginia | 34.4 | $1,126 ±$15 | $32.69 |
| 8 | District of Columbia | 33.5 | $1,432 ±$68 | $42.69 |
| 9 | Massachusetts | 33.1 | $1,381 ±$23 | $41.76 |
| 10 | Washington | 32.8 | $1,259 ±$21 | $38.42 |
| 11 | Connecticut | 31.9 | $1,226 ±$19 | $38.42 |
| 12 | Hawaii | 31.9 | $1,614 ±$48 | $50.62 |
| 13 | Utah | 31.4 | $959 ±$18 | $30.56 |
| 14 | New York | 31.2 | $1,281 ±$14 | $41.01 |
| 15 | Delaware | 31.1 | $1,093 ±$33 | $35.11 |
| 16 | California | 31.1 | $1,562 ±$10 | $50.20 |
| 17 | Texas | 30.0 | $1,040 ±$7 | $34.61 |
| 18 | Kansas | 29.1 | $836 ±$12 | $28.69 |
| 19 | Pennsylvania | 28.9 | $962 ±$10 | $33.26 |
| 20 | Georgia | 28.8 | $940 ±$13 | $32.63 |
| 21 | Illinois | 28.8 | $1,000 ±$12 | $34.74 |
| 22 | Tennessee | 28.6 | $828 ±$12 | $28.91 |
| 23 | Maine | 28.6 | $903 ±$24 | $31.55 |
| 24 | Rhode Island | 28.5 | $1,065 ±$34 | $37.33 |
| 25 | Iowa | 28.5 | $797 ±$11 | $27.97 |
| 26 | Louisiana | 28.1 | $844 ±$11 | $30.00 |
| 27 | Nebraska | 28.1 | $847 ±$14 | $30.16 |
| 28 | North Carolina | 28.0 | $846 ±$10 | $30.26 |
| 29 | South Carolina | 27.7 | $839 ±$16 | $30.25 |
| 30 | Arizona | 27.6 | $1,007 ±$15 | $36.43 |
| 31 | Indiana | 27.6 | $827 ±$8 | $29.96 |
| 32 | Alaska | 27.6 | $1,162 ±$33 | $42.14 |
| 33 | Minnesota | 27.6 | $1,033 ±$19 | $37.47 |
| 34 | Missouri | 27.4 | $819 ±$10 | $29.94 |
| 35 | South Dakota | 27.3 | $755 ±$20 | $27.65 |
| 36 | Alabama | 27.0 | $752 ±$14 | $27.85 |
| 37 | Mississippi | 26.9 | $743 ±$17 | $27.62 |
| 38 | Oklahoma | 26.9 | $798 ±$11 | $29.69 |
| 39 | Ohio | 26.2 | $810 ±$7 | $30.87 |
| 40 | Montana | 26.2 | $830 ±$20 | $31.71 |
| 41 | Kentucky | 26.0 | $772 ±$10 | $29.70 |
| 42 | Michigan | 26.0 | $881 ±$9 | $33.94 |
| 43 | Nevada | 25.6 | $1,049 ±$18 | $40.97 |
| 44 | North Dakota | 25.6 | $786 ±$24 | $30.71 |
| 45 | Wisconsin | 25.5 | $860 ±$7 | $33.73 |
| 46 | Oregon | 25.5 | $1,118 ±$16 | $43.86 |
| 47 | Idaho | 25.4 | $814 ±$21 | $32.11 |
| 48 | Wyoming | 25.1 | $785 ±$20 | $31.30 |
| 49 | West Virginia | 24.7 | $723 ±$16 | $29.27 |
| 50 | Arkansas | 24.4 | $700 ±$15 | $28.68 |
| 51 | New Mexico | 23.5 | $806 ±$18 | $34.29 |
2017 state rankings
Maryland ranked first at 38.0 hours. Rent took the fewest hours in New Mexico, at 23.3. The U.S. benchmark was 29.5 hours.
| Rank | State or D.C. | Gross RN hours | Census median two-bedroom gross rent/month ± margin | Median RN pay per hour |
|---|---|---|---|---|
| 1 | Maryland | 38.0 | $1,355 ±$16 | $35.63 |
| 2 | District of Columbia | 37.4 | $1,566 ±$96 | $41.85 |
| 3 | Florida | 36.7 | $1,113 ±$8 | $30.32 |
| 4 | Colorado | 36.1 | $1,238 ±$22 | $34.27 |
| 5 | New Hampshire | 34.8 | $1,147 ±$21 | $32.97 |
| 6 | New Jersey | 34.6 | $1,346 ±$14 | $38.90 |
| 7 | Virginia | 33.8 | $1,074 ±$17 | $31.76 |
| 8 | Vermont | 33.8 | $1,078 ±$44 | $31.94 |
| 9 | Hawaii | 32.4 | $1,598 ±$54 | $49.26 |
| 10 | Delaware | 31.9 | $1,099 ±$25 | $34.43 |
| 11 | Massachusetts | 31.7 | $1,292 ±$18 | $40.72 |
| 12 | Washington | 31.7 | $1,180 ±$16 | $37.24 |
| 13 | Utah | 31.1 | $920 ±$21 | $29.55 |
| 14 | Connecticut | 31.1 | $1,188 ±$17 | $38.22 |
| 15 | California | 30.6 | $1,480 ±$7 | $48.43 |
| 16 | New York | 30.4 | $1,223 ±$14 | $40.23 |
| 17 | Alaska | 29.1 | $1,208 ±$34 | $41.45 |
| 18 | Kansas | 29.1 | $822 ±$11 | $28.29 |
| 19 | Illinois | 29.0 | $977 ±$8 | $33.74 |
| 20 | Texas | 28.6 | $973 ±$7 | $34.01 |
| 21 | Iowa | 28.3 | $771 ±$10 | $27.27 |
| 22 | Maine | 28.3 | $868 ±$25 | $30.71 |
| 23 | South Dakota | 28.1 | $752 ±$18 | $26.76 |
| 24 | Georgia | 27.9 | $887 ±$11 | $31.78 |
| 25 | Pennsylvania | 27.9 | $915 ±$11 | $32.80 |
| 26 | Louisiana | 27.9 | $821 ±$11 | $29.47 |
| 27 | South Carolina | 27.8 | $822 ±$12 | $29.58 |
| 28 | Nebraska | 27.7 | $812 ±$16 | $29.27 |
| 29 | Tennessee | 27.7 | $787 ±$10 | $28.41 |
| 30 | North Carolina | 27.7 | $810 ±$9 | $29.27 |
| 31 | Indiana | 27.6 | $803 ±$9 | $29.12 |
| 32 | Rhode Island | 27.4 | $1,000 ±$33 | $36.51 |
| 33 | Arizona | 27.0 | $965 ±$10 | $35.70 |
| 34 | Missouri | 27.0 | $789 ±$10 | $29.21 |
| 35 | North Dakota | 26.6 | $790 ±$19 | $29.67 |
| 36 | Minnesota | 26.6 | $994 ±$16 | $37.41 |
| 37 | Alabama | 26.5 | $721 ±$12 | $27.20 |
| 38 | Oklahoma | 26.5 | $770 ±$9 | $29.05 |
| 39 | Wyoming | 25.8 | $785 ±$28 | $30.43 |
| 40 | Mississippi | 25.7 | $703 ±$15 | $27.31 |
| 41 | Michigan | 25.7 | $846 ±$8 | $32.87 |
| 42 | Ohio | 25.6 | $779 ±$7 | $30.43 |
| 43 | Wisconsin | 25.4 | $830 ±$8 | $32.65 |
| 44 | Montana | 25.2 | $781 ±$23 | $31.04 |
| 45 | Idaho | 25.0 | $769 ±$18 | $30.78 |
| 46 | Arkansas | 24.6 | $682 ±$13 | $27.68 |
| 47 | Oregon | 24.3 | $1,043 ±$19 | $42.92 |
| 48 | Kentucky | 24.2 | $703 ±$11 | $29.01 |
| 49 | West Virginia | 24.2 | $691 ±$16 | $28.60 |
| 50 | Nevada | 23.9 | $978 ±$15 | $40.87 |
| 51 | New Mexico | 23.3 | $780 ±$19 | $33.45 |
2016 state rankings
Maryland ranked first at 37.4 hours. Rent took the fewest hours in Nevada, at 23.0. The U.S. benchmark was 29.3 hours.
| Rank | State or D.C. | Gross RN hours | Census median two-bedroom gross rent/month ± margin | Median RN pay per hour |
|---|---|---|---|---|
| 1 | Maryland | 37.4 | $1,321 ±$16 | $35.31 |
| 2 | Florida | 35.6 | $1,073 ±$7 | $30.15 |
| 3 | Colorado | 35.2 | $1,162 ±$15 | $33.05 |
| 4 | District of Columbia | 35.0 | $1,348 ±$63 | $38.47 |
| 5 | Hawaii | 34.7 | $1,519 ±$52 | $43.76 |
| 6 | New Jersey | 34.4 | $1,318 ±$14 | $38.36 |
| 7 | Virginia | 34.3 | $1,064 ±$17 | $31.00 |
| 8 | New Hampshire | 34.1 | $1,094 ±$24 | $32.07 |
| 9 | Vermont | 32.6 | $1,023 ±$37 | $31.36 |
| 10 | Massachusetts | 31.4 | $1,273 ±$22 | $40.58 |
| 11 | Connecticut | 31.0 | $1,158 ±$17 | $37.33 |
| 12 | New York | 30.9 | $1,196 ±$13 | $38.65 |
| 13 | Delaware | 30.6 | $1,020 ±$37 | $33.32 |
| 14 | Utah | 30.6 | $893 ±$15 | $29.23 |
| 15 | Alaska | 29.3 | $1,203 ±$38 | $41.01 |
| 16 | Maine | 29.1 | $866 ±$22 | $29.76 |
| 17 | South Dakota | 29.0 | $758 ±$20 | $26.14 |
| 18 | Washington | 28.9 | $1,088 ±$15 | $37.71 |
| 19 | Illinois | 28.8 | $952 ±$9 | $33.03 |
| 20 | California | 28.8 | $1,392 ±$8 | $48.30 |
| 21 | Iowa | 28.5 | $759 ±$10 | $26.59 |
| 22 | Texas | 28.4 | $939 ±$6 | $33.02 |
| 23 | Kansas | 28.4 | $780 ±$13 | $27.50 |
| 24 | Pennsylvania | 28.3 | $906 ±$10 | $32.05 |
| 25 | Georgia | 28.2 | $871 ±$10 | $30.93 |
| 26 | Tennessee | 28.1 | $779 ±$9 | $27.69 |
| 27 | Rhode Island | 27.7 | $988 ±$19 | $35.73 |
| 28 | Louisiana | 27.4 | $802 ±$16 | $29.24 |
| 29 | Indiana | 27.4 | $775 ±$8 | $28.27 |
| 30 | North Dakota | 27.4 | $787 ±$19 | $28.77 |
| 31 | South Carolina | 27.3 | $799 ±$14 | $29.32 |
| 32 | North Carolina | 27.2 | $779 ±$9 | $28.65 |
| 33 | Nebraska | 27.2 | $773 ±$13 | $28.45 |
| 34 | Missouri | 27.1 | $765 ±$7 | $28.28 |
| 35 | Alabama | 26.8 | $714 ±$12 | $26.68 |
| 36 | Arizona | 26.8 | $935 ±$10 | $34.94 |
| 37 | Minnesota | 26.7 | $956 ±$10 | $35.80 |
| 38 | Wyoming | 26.6 | $785 ±$29 | $29.54 |
| 39 | Oklahoma | 25.8 | $734 ±$8 | $28.49 |
| 40 | Michigan | 25.7 | $833 ±$7 | $32.43 |
| 41 | Ohio | 25.6 | $767 ±$6 | $29.95 |
| 42 | Mississippi | 25.6 | $687 ±$12 | $26.86 |
| 43 | Montana | 25.4 | $761 ±$24 | $29.98 |
| 44 | Wisconsin | 25.3 | $808 ±$8 | $31.94 |
| 45 | Arkansas | 25.2 | $687 ±$12 | $27.26 |
| 46 | Idaho | 24.7 | $740 ±$20 | $29.90 |
| 47 | Kentucky | 24.6 | $696 ±$10 | $28.33 |
| 48 | New Mexico | 24.1 | $782 ±$26 | $32.49 |
| 49 | West Virginia | 24.0 | $672 ±$20 | $27.98 |
| 50 | Oregon | 23.0 | $975 ±$13 | $42.32 |
| 51 | Nevada | 23.0 | $928 ±$14 | $40.36 |
2015 state rankings
Maryland ranked first at 37.8 hours. Rent took the fewest hours in Oregon, at 22.1. The U.S. benchmark was 29.0 hours.
| Rank | State or D.C. | Gross RN hours | Census median two-bedroom gross rent/month ± margin | Median RN pay per hour |
|---|---|---|---|---|
| 1 | Maryland | 37.8 | $1,310 ±$17 | $34.66 |
| 2 | District of Columbia | 35.2 | $1,347 ±$66 | $38.28 |
| 3 | New Hampshire | 35.1 | $1,105 ±$20 | $31.46 |
| 4 | Virginia | 34.8 | $1,064 ±$14 | $30.60 |
| 5 | Vermont | 34.5 | $1,041 ±$44 | $30.18 |
| 6 | Florida | 34.3 | $1,024 ±$7 | $29.87 |
| 7 | New Jersey | 33.8 | $1,287 ±$14 | $38.09 |
| 8 | Colorado | 33.3 | $1,098 ±$15 | $32.95 |
| 9 | Hawaii | 32.8 | $1,457 ±$34 | $44.37 |
| 10 | New York | 31.5 | $1,180 ±$11 | $37.49 |
| 11 | Connecticut | 31.3 | $1,151 ±$17 | $36.76 |
| 12 | Massachusetts | 30.6 | $1,234 ±$19 | $40.36 |
| 13 | Delaware | 30.1 | $1,028 ±$34 | $34.16 |
| 14 | Utah | 29.9 | $857 ±$15 | $28.69 |
| 15 | Illinois | 29.3 | $945 ±$9 | $32.28 |
| 16 | Kansas | 28.7 | $776 ±$13 | $27.08 |
| 17 | Iowa | 28.6 | $741 ±$11 | $25.92 |
| 18 | Maine | 28.4 | $859 ±$19 | $30.21 |
| 19 | Pennsylvania | 28.3 | $893 ±$8 | $31.58 |
| 20 | Georgia | 28.1 | $852 ±$9 | $30.36 |
| 21 | Texas | 27.9 | $919 ±$6 | $32.98 |
| 22 | Washington | 27.8 | $1,031 ±$14 | $37.03 |
| 23 | North Dakota | 27.8 | $774 ±$17 | $27.83 |
| 24 | Indiana | 27.6 | $769 ±$8 | $27.83 |
| 25 | Tennessee | 27.6 | $755 ±$8 | $27.33 |
| 26 | Alaska | 27.6 | $1,170 ±$29 | $42.37 |
| 27 | Louisiana | 27.5 | $789 ±$12 | $28.74 |
| 28 | California | 27.4 | $1,325 ±$7 | $48.27 |
| 29 | South Carolina | 27.4 | $783 ±$10 | $28.53 |
| 30 | North Carolina | 27.3 | $774 ±$7 | $28.34 |
| 31 | Nebraska | 27.3 | $760 ±$17 | $27.87 |
| 32 | Missouri | 27.3 | $757 ±$8 | $27.77 |
| 33 | Minnesota | 27.2 | $945 ±$11 | $34.68 |
| 34 | South Dakota | 26.9 | $692 ±$22 | $25.68 |
| 35 | Oklahoma | 26.4 | $742 ±$9 | $28.10 |
| 36 | Rhode Island | 26.4 | $968 ±$18 | $36.68 |
| 37 | Montana | 26.3 | $768 ±$19 | $29.19 |
| 38 | Alabama | 26.3 | $702 ±$13 | $26.70 |
| 39 | Mississippi | 25.9 | $693 ±$14 | $26.74 |
| 40 | Michigan | 25.9 | $819 ±$8 | $31.65 |
| 41 | Wisconsin | 25.9 | $810 ±$7 | $31.32 |
| 42 | Arizona | 25.6 | $880 ±$10 | $34.38 |
| 43 | Ohio | 25.6 | $754 ±$6 | $29.46 |
| 44 | Wyoming | 25.6 | $747 ±$22 | $29.22 |
| 45 | Arkansas | 25.1 | $673 ±$12 | $26.76 |
| 46 | Kentucky | 24.8 | $690 ±$8 | $27.87 |
| 47 | West Virginia | 24.6 | $670 ±$20 | $27.26 |
| 48 | Idaho | 24.6 | $720 ±$17 | $29.31 |
| 49 | New Mexico | 23.9 | $745 ±$25 | $31.11 |
| 50 | Nevada | 23.6 | $922 ±$10 | $39.12 |
| 51 | Oregon | 22.1 | $904 ±$10 | $40.96 |
How the historical editions were calculated
Rent hours equal a state’s median monthly gross rent for a two-bedroom home divided by its median hourly RN wage, before taxes. The American Community Survey measures rent over the calendar year for households paying cash rent and includes utilities and fuel paid separately by tenants. The Bureau of Labor Statistics measures wages for RN employees each May. Both figures are in that year’s dollars.
Ranks use unrounded values. When two places have the same ratio, the one with lower rent ranks first. If rents also match, they share a rank. The metro rankings use HUD Fair Market Rents for recent movers.
For comparisons over time, allow for sampling error and changes to the source methods. BLS combines six semiannual survey panels. Adjacent releases share four panels. May 2022 and May 2025 share none. BLS began using its model-based estimation method in the May 2021 release and changed wage processing in May 2022. Census raised its upper processing limit on contract rent in 2024 and advises caution in high-rent areas. The ACS margin measures uncertainty in rent alone. The wage files do not report a standard error for the median, so close rankings or changes in hours should be read as point estimates.
Data releases by edition
The dates below are when Census and BLS released each year’s estimates. In the American Community Survey, two-bedroom rent is line 4 of table B25031. Newer files label the estimate B25031_E004 and its margin of error B25031_M004. In the BLS wage files, the median hourly wage is H_MEDIAN for registered nurses (occupation 29-1141).
| Reference year | Census one-year rent release | BLS May wage release | BLS U.S. file |
|---|---|---|---|
| 2025 | 2026-10-29 · rent | 2026-05-15 · states | National wages |
| 2024 | 2025-09-11 · rent | 2025-04-02 · states | National wages |
| 2023 | 2024-09-12 · rent | 2024-04-03 · states | National wages |
| 2022 | 2023-09-14 · rent | 2023-04-25 · states | National wages |
| 2021 | 2022-09-15 · rent | 2022-03-31 · states | National wages |
| 2019 | 2020-09-17 · rent | 2020-03-31 · states | National wages |
| 2018 | 2019-09-26 · rent | 2019-03-29 · states | National wages |
| 2017 | 2018-09-13 · rent | 2018-03-30 · states | National wages |
| 2016 | 2017-09-14 · rent | 2017-03-31 · states | National wages |
| 2015 | 2016-09-15 · rent | 2016-03-30 · states | National wages |
The May 2024 row gives the national wage release date. BLS released Colorado’s May 2024 figures separately on July 23, 2025.
Citing this study
Credit the historical rankings to NurseRecruiter’s Rent in RN Hours by State and Year and link to this article. Identify the year of the result and credit Census ACS two-bedroom gross rents and BLS median RN hourly wages as the underlying data. The series covers 2015–2019 and 2021–2025.
Sources
- U.S. Census Bureau, American Community Survey summary files (accessed 2026-11-20). Standard one-year state, D.C. and national B25031 files for the ten listed years.
- Census, 2015 one-year table changes (accessed 2026-11-20). Introduction of median gross rent by bedroom count.
- Census, 2020 experimental data (accessed 2026-11-20). Changes in collection and publication.
- Census, contract rent processing change (accessed 2026-11-20). Revised upper limit and high-rent comparisons.
- U.S. Bureau of Labor Statistics, Occupational Employment and Wage Statistics tables (accessed 2026-11-20). State and national RN wage files for 2015–2019 and 2021–2025.
- BLS, OEWS survey methods and comparability (accessed 2026-11-20). Panel design and use of wage estimates over time.
- BLS, history of the wage survey (accessed 2026-11-20). Changes to the May 2021 and May 2022 estimates.
- BLS, publication of the Colorado May 2024 estimates (accessed 2026-11-20). State-specific release date.