
In the South Bend-Mishawaka, Indiana-Michigan wage-reporting area, the U.S. Bureau of Labor Statistics estimated 3,370 registered nurse jobs in May 2025, with median pay of $44.97 an hour ($93,540 a year). These figures cover the reporting area, not Granger alone.
Registered nurses holding an active multistate license from another compact state can practice in Indiana without a separate state license under the Nurse Licensure Compact. The Indiana State Board of Nursing licenses registered nurses.
Employment and pay by nursing occupation
The Census Bureau’s 2020–2024 American Community Survey estimated 30,321 ±575 residents in Granger CDP. The ± figure is the 90% margin of error. This population estimate covers the named locality and the five-year survey period, not the wider wage reporting area or a July 2025 population.
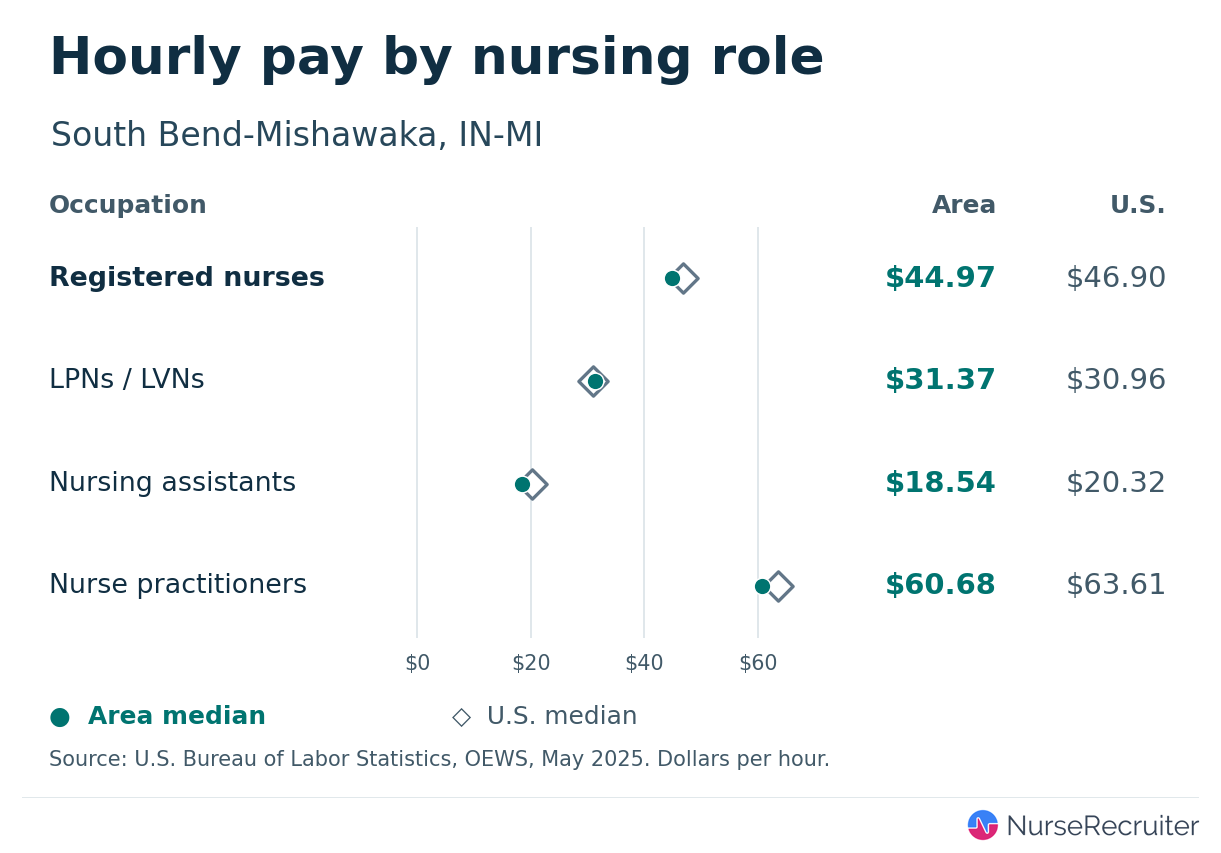
NurseRecruiter compiled these May 2025 BLS employer estimates for South Bend-Mishawaka, IN-MI. The 25th and 75th percentiles mark the middle half of hourly wages within each occupation.
| Nursing occupation | Employment | Hourly 25th percentile | Hourly median | Hourly 75th percentile | Annual median |
|---|---|---|---|---|---|
| Registered nurses | 3,370 | $38.80 | $44.97 | $55.93 | $93,540 |
| LPNs and LVNs | 610 | $29.25 | $31.37 | $35.12 | $65,240 |
| Nursing assistants | 1,520 | $17.75 | $18.54 | $20.81 | $38,550 |
| Nurse practitioners | 310 | $52.73 | $60.68 | $64.40 | $126,220 |
| Nurse anesthetists | — | — | — | — | — |
| Nurse midwives | — | — | — | — | — |
The RN median was 4.1% below the U.S. median of $46.90 an hour. The RN location quotient was 1.18. A value of 1.00 means RNs account for the same share of local payroll jobs as they do nationally. BLS reports straight-time wages across employers. Overtime, shift differentials and employer benefit costs are excluded. A dash means BLS did not publish a usable numeric estimate for that cell.
Lower regional prices stretched RN pay further in the South Bend-Mishawaka, IN-MI metro. In NurseRecruiter’s RN Purchasing Power study, the region’s $41.18 median hourly wage had buying power of $44.35 at national average prices, ranking 144th of 380. Compared with 2023’s $43.34 median, estimated purchasing power fell 8.9% after inflation. Its annual comparison rank moved from 38th to 105th, down 67 places, among the same 269 matched metros. BLS May 2024 wages and BEA 2024 prices cover the metro, not the city alone; pay is before taxes.
Local nursing workplaces
Care providers with Granger addresses include 2 home health agencies and 1 nursing home. Mishawaka and South Bend share that wage benchmark and provide other places to compare employers.
These examples identify reporting sites and documented services. A provider’s mailing city can differ from its service territory.
| Workplace | Documented nursing setting |
|---|---|
| Belltower Health & Rehabilitation Center | CMS lists 96 certified beds, an average of 86.1 residents per day, and chain affiliation with Fundamental Healthcare. Reported RN staffing was 0.53 hours per resident day for April–June 2026. See long-term and post-acute nursing. |
| Purposecare of Indiana | The agency lists nursing care along with physical therapy, occupational therapy, and medical social services. Its reporting address identifies the agency office; the home-visit territory can extend beyond it. See home health nursing. |
Health care employment
In 2024, Census workplace records counted 701 health care and social assistance jobs out of 4,170 covered jobs in Granger (16.8%). The industry count includes clinical and nonclinical jobs located there. A person holding two covered jobs can contribute to both.
The 2020–24 American Community Survey estimated 1,431 ±255 healthcare practitioners and technical workers and 189 ±90 healthcare support workers living in Granger. These are employed residents aged 16 and older, counted by occupation wherever they worked. The ± figures are 90% margins of error. Both groups include occupations beyond nursing.
Local employers and care settings
Medicare provider files use postal addresses, which may differ from municipal boundaries. Examples are named providers in the files. Provider counts measure services and facilities, not job openings.
| Care setting | Listed providers | Examples from the provider file |
|---|---|---|
| Nursing homes | 1 | Belltower Health & Rehabilitation Center |
| Home health agencies | 2 | Aunova Home Care LLC |
1 listed nursing home reported 96 certified beds.
Contract nursing in local nursing homes
In April–June 2026, the one nursing home with a Granger, IN mailing address and complete, usable daily staffing records recorded 2.0 contractor RN hours and 3,681.0 employee RN hours. Contractors supplied <0.1% of these staff RN hours. Employee hours can include directly employed per diem nurses. Contractor hours can include several staffing arrangements. The figures exclude director and administrative RN hours; they measure work already performed at nursing homes.
Health industry employment in St. Joseph County
BLS annual payroll records cover these private employers throughout St. Joseph County. Jobs include nurses, other clinicians, and administrative and support staff. Government payrolls are excluded.
| Private-sector industry | Establishments | Average payroll jobs in 2025 | Change from 2024 |
|---|---|---|---|
| Ambulatory health care services | 494 | 8,096 | +344 |
| Hospitals | 12 | 6,960 | -438 |
| Nursing and residential care facilities | 66 | 3,979 | +167 |
Compare nearby nursing markets
Compare Mishawaka and South Bend.
All three guides use the same BLS estimate: $44.97 per hour for RNs in South Bend-Mishawaka, IN-MI in May 2025.
| Location | CMS-listed nursing homes |
|---|---|
| Granger | 1 |
| Mishawaka | 3 |
| South Bend | 10 |
For a statewide comparison, see regional RN pay in Indiana.
Related topics
- Nursing in Indiana
- Nursing in Mishawaka, Indiana — Compare nursing homes across the nearby markets.
- Long-Term and Post-Acute Care Nursing — Background for the Belltower Health & Rehabilitation Center entry in the workplace table.
- Home Health Nursing — Background for the Purposecare of Indiana entry in the workplace table.
Sources
-
Indiana State Board of Nursing (accessed 2026-11-18).
-
Nurse Licensure Compact, NLC map and implementation status (PDF) (accessed 2026-11-18).
-
BLS, May 2025 metropolitan and nonmetropolitan occupational employment and wage estimates (accessed 2026-11-13).
-
U.S. Census Bureau, LEHD Origin-Destination Employment Statistics, workplace series (accessed 2026-11-13).
-
U.S. Census Bureau, 2020–24 ACS, occupation of employed residents (C24010) (accessed 2026-11-13).
-
BLS, 2025 QCEW annual data for St. Joseph County (CSV) (accessed 2026-11-13).
-
CMS Provider Data Catalog, Provider Information (accessed 2026-11-13).
-
CMS Provider Data Catalog, Home Health Care Agencies (accessed 2026-11-13).
-
BLS, May 2025 survey definitions and pay coverage (accessed 2026-11-13).
-
CMS, Payroll-Based Journal daily nurse staffing, April–June 2026 (accessed 2026-11-13)
-
CMS, Payroll-Based Journal staffing methodology (accessed 2026-11-13)
-
U.S. Census Bureau, 2025 Gazetteer geographic reference points (accessed 2026-11-13)
-
U.S. Census Bureau, 2020–2024 ACS five-year total population (B01003) (accessed 2026-11-19).
-
NurseRecruiter, RN Purchasing Power, 2024 results (accessed 2026-11-20): BLS median RN wages and BEA regional prices; annual changes use comparable 2023–2024 observations.