
California has the largest projected RN shortage in 2038, at 84,750 full-time equivalents, or 21.9% of the state's projected demand. NurseRecruiter ranked all 50 states and D.C. using the baseline forecast from the federal Health Resources and Services Administration (HRSA). Projected demand exceeds supply in 24 states. In the other 26 states and D.C., projected supply is larger.
Find a state in the shortfall table or the surplus table.
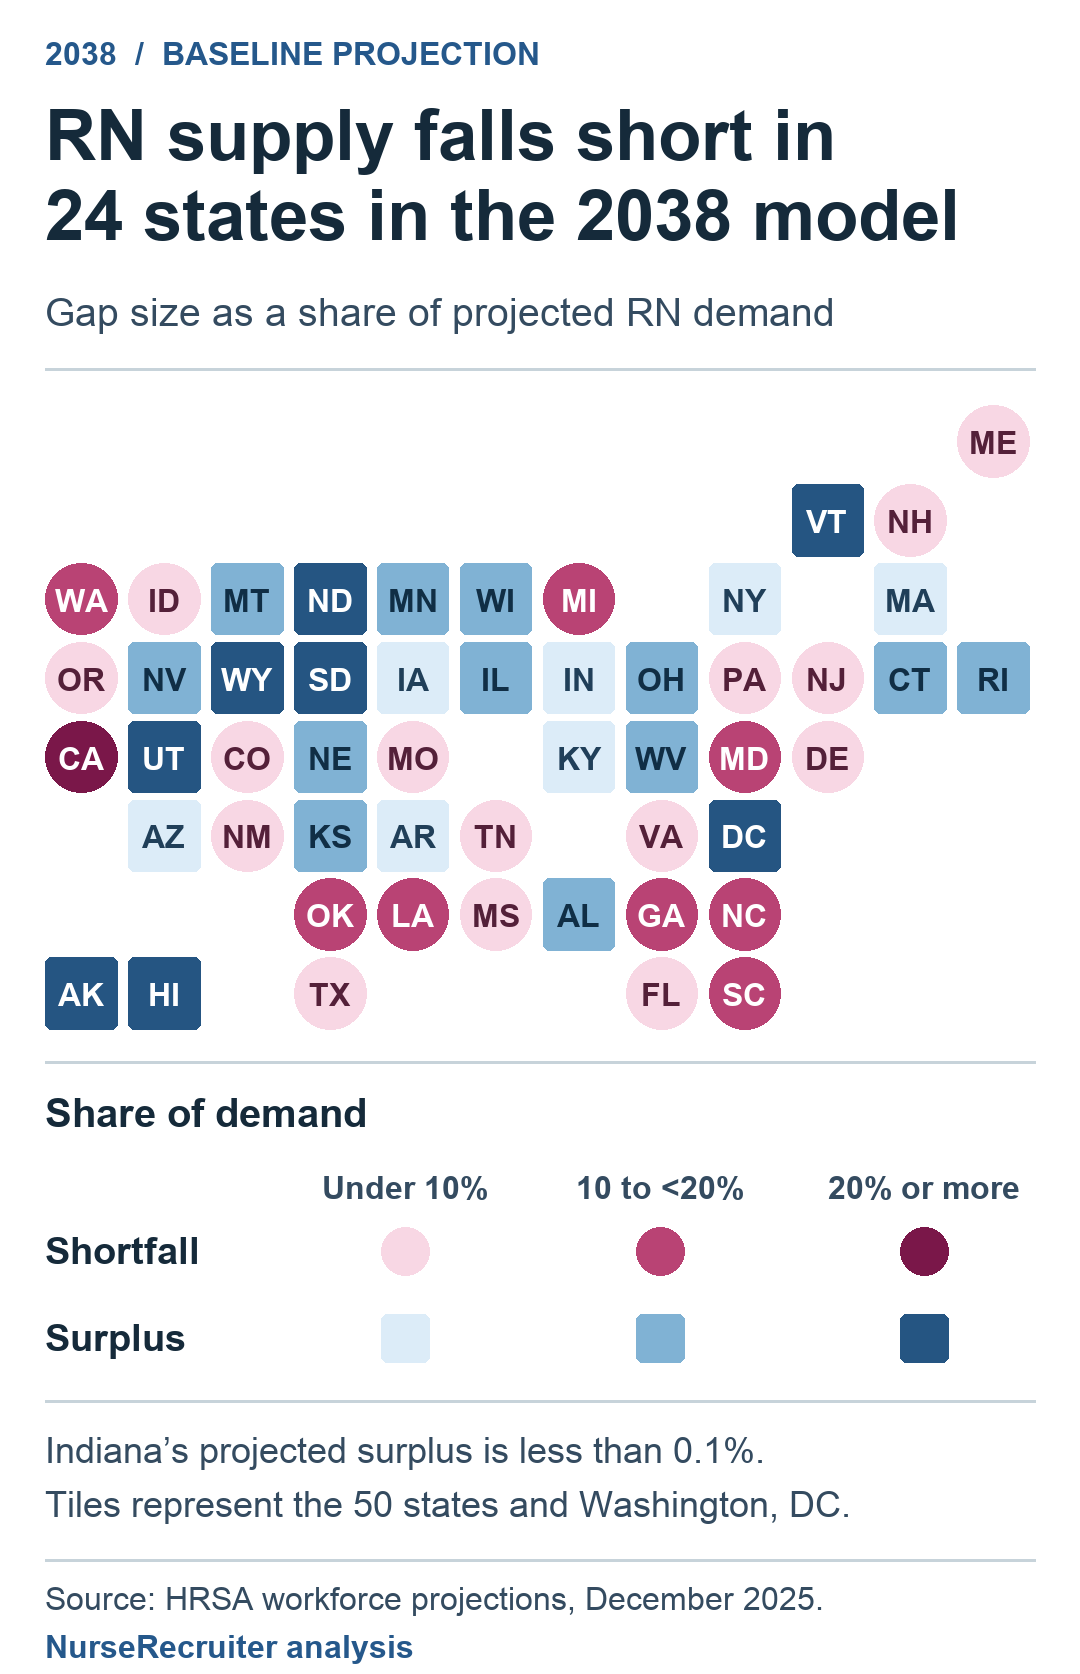
Michigan and Ohio share a border. Michigan’s projected shortfall is 18.0% of RN demand, while Ohio’s projected surplus is 17.5%. The circles mark shortfalls and the squares mark surpluses.
States with projected RN shortages
These 24 states are ordered by the share of projected 2038 demand left uncovered. One FTE represents 40 hours of RN work per week. Both employment capacity and demand come from the same baseline scenario.
| Rank and state | Supply FTEs | Demand FTEs | Shortfall FTEs | Shortfall (% of demand) |
|---|---|---|---|---|
| 1. California | 302,790 | 387,540 | 84,750 | 21.9% |
| 2. North Carolina | 105,010 | 130,720 | 25,710 | 19.7% |
| 3. Georgia | 102,870 | 127,980 | 25,110 | 19.6% |
| 4. Michigan | 92,540 | 112,830 | 20,290 | 18.0% |
| 5. Washington | 72,930 | 87,950 | 15,020 | 17.1% |
| 6. Maryland | 56,930 | 67,820 | 10,890 | 16.1% |
| 7. Oklahoma | 38,920 | 44,820 | 5,900 | 13.2% |
| 8. South Carolina | 55,270 | 62,520 | 7,250 | 11.6% |
| 9. Louisiana | 45,780 | 51,460 | 5,680 | 11.0% |
| 10. Virginia | 86,820 | 94,840 | 8,020 | 8.5% |
| 11. Pennsylvania | 142,870 | 154,840 | 11,970 | 7.7% |
| 12. Texas | 286,210 | 307,520 | 21,310 | 6.9% |
| 13. New Hampshire | 16,030 | 17,190 | 1,160 | 6.7% |
| 14. Colorado | 59,000 | 63,250 | 4,250 | 6.7% |
| 15. Oregon | 45,760 | 48,650 | 2,890 | 5.9% |
| 16. Idaho | 19,900 | 21,110 | 1,210 | 5.7% |
| 17. Maine | 16,940 | 17,960 | 1,020 | 5.7% |
| 18. New Jersey | 87,050 | 91,370 | 4,320 | 4.7% |
| 19. New Mexico | 19,860 | 20,230 | 370 | 1.8% |
| 20. Delaware | 11,990 | 12,200 | 210 | 1.7% |
| 21. Florida | 274,870 | 277,730 | 2,860 | 1.0% |
| 22. Missouri | 68,550 | 68,730 | 180 | 0.3% |
| 23. Mississippi | 34,090 | 34,140 | 50 | 0.1% |
| 24. Tennessee | 80,600 | 80,660 | 60 | 0.1% |
States where projected RN supply exceeds demand
The other 26 states and D.C. are ordered by the size of their percentage surplus. Wyoming leads on that measure. Its forecast has 9,760 RN FTEs available against demand for 5,440, a difference of 4,320. By contrast, Ohio's forecast surplus of 22,170 FTEs is much larger in absolute terms and represents 17.5% of its projected demand.
An employer in a state with a projected surplus can still have vacancies at a specific hospital, on a particular shift, or in a specialty. The state totals combine workplaces and schedules. HRSA also models nurse anesthetists and other advanced practice occupations separately.
| Rank and state | Supply FTEs | Demand FTEs | Surplus FTEs | Surplus (% of demand) |
|---|---|---|---|---|
| 1. Wyoming | 9,760 | 5,440 | 4,320 | 79.4% |
| 2. District of Columbia | 9,770 | 6,360 | 3,410 | 53.6% |
| 3. North Dakota | 11,960 | 8,020 | 3,940 | 49.1% |
| 4. South Dakota | 14,110 | 9,960 | 4,150 | 41.7% |
| 5. Utah | 49,520 | 35,390 | 14,130 | 39.9% |
| 6. Vermont | 9,030 | 6,570 | 2,460 | 37.4% |
| 7. Alaska | 9,660 | 7,450 | 2,210 | 29.7% |
| 8. Hawaii | 17,410 | 13,690 | 3,720 | 27.2% |
| 9. Nevada | 36,980 | 30,960 | 6,020 | 19.4% |
| 10. Wisconsin | 71,960 | 60,480 | 11,480 | 19.0% |
| 11. Alabama | 69,440 | 58,380 | 11,060 | 18.9% |
| 12. Rhode Island | 14,090 | 11,930 | 2,160 | 18.1% |
| 13. Ohio | 148,820 | 126,650 | 22,170 | 17.5% |
| 14. West Virginia | 23,220 | 19,780 | 3,440 | 17.4% |
| 15. Montana | 14,150 | 12,230 | 1,920 | 15.7% |
| 16. Kansas | 34,060 | 29,590 | 4,470 | 15.1% |
| 17. Illinois | 137,120 | 119,820 | 17,300 | 14.4% |
| 18. Connecticut | 43,120 | 37,790 | 5,330 | 14.1% |
| 19. Minnesota | 71,200 | 62,680 | 8,520 | 13.6% |
| 20. Nebraska | 22,950 | 20,810 | 2,140 | 10.3% |
| 21. Arkansas | 36,570 | 33,970 | 2,600 | 7.7% |
| 22. Massachusetts | 80,120 | 74,910 | 5,210 | 7.0% |
| 23. Kentucky | 59,330 | 56,990 | 2,340 | 4.1% |
| 24. Iowa | 34,690 | 33,350 | 1,340 | 4.0% |
| 25. New York | 195,890 | 190,890 | 5,000 | 2.6% |
| 26. Arizona | 86,070 | 85,420 | 650 | 0.8% |
| 27. Indiana | 75,390 | 75,360 | 30 | <0.1% |
Why Texas ranks fourth by size and twelfth by share
Texas ranks fourth by the number of RN full-time equivalents it is projected to lack in 2038 and twelfth by its shortfall as a share of demand. Michigan illustrates why the rankings diverge. Its projected gap of 20,290 FTEs is close to Texas’s 21,310. But Texas is projected to need 307,520 RN FTEs in total, nearly three times Michigan’s 112,830.
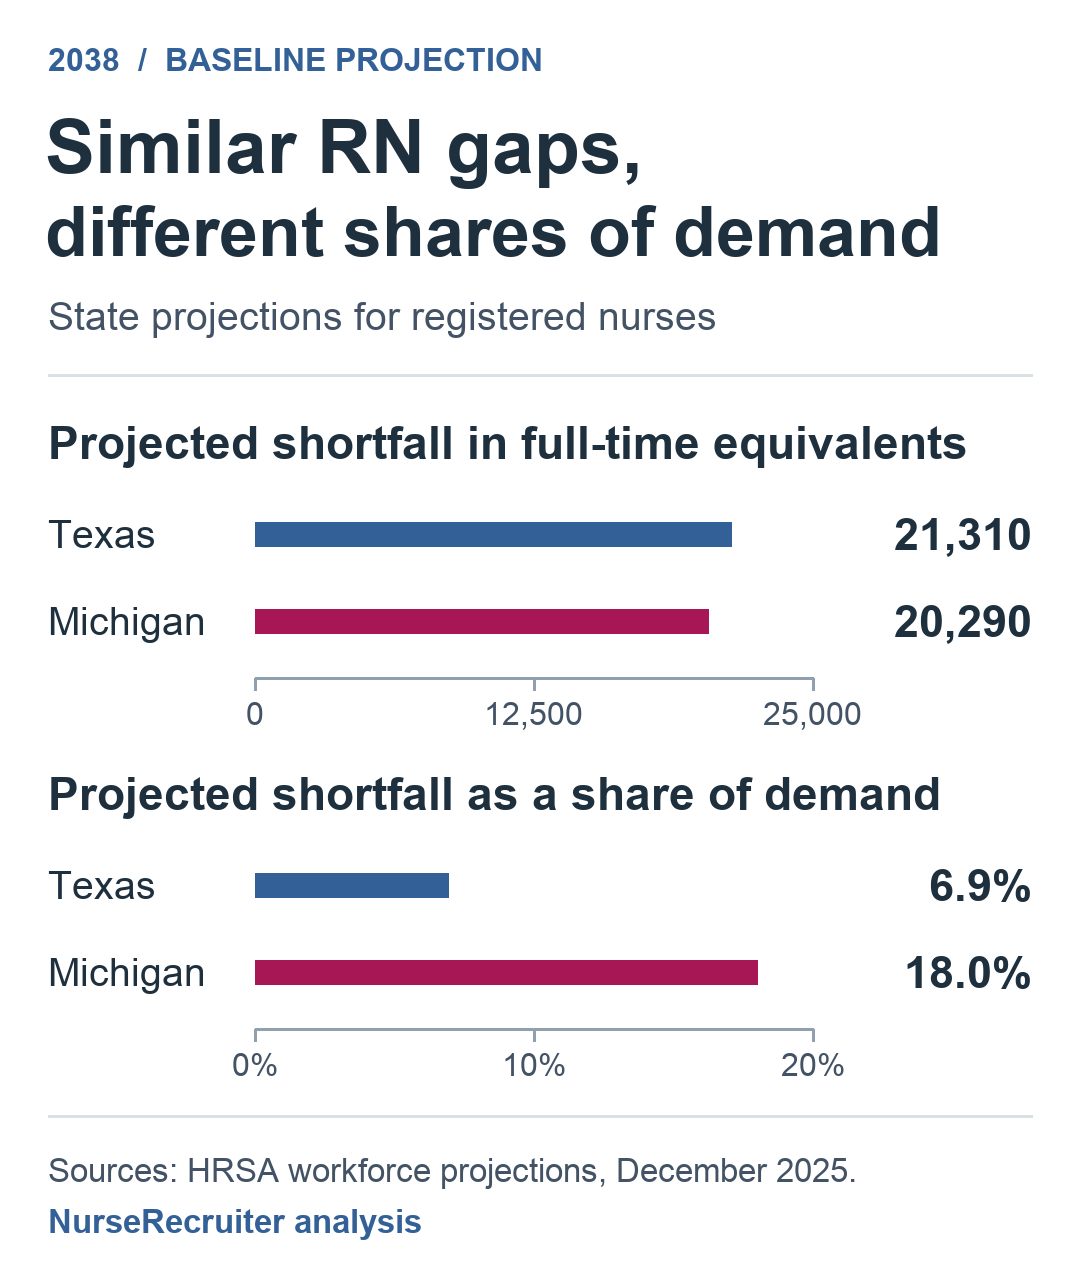
A gap of roughly 20,000 RN full-time equivalents represents 18.0% of projected demand in Michigan and 6.9% in Texas.
For a health system estimating the additional nursing hours a market may need, start with the gap in FTEs. To compare markets of different sizes, use the share of projected demand. A nurse choosing where to apply this year needs recent evidence about the employers hiring there. Hospital vacancy rates and hiring times measure conditions during a specific survey period.
How NurseRecruiter calculated the rankings
We used HRSA’s December 2025 workbook and selected its 2038 baseline supply and demand estimates for registered nurses in each state and D.C. The workbook’s “Total” rurality setting combines urban and rural areas within each jurisdiction. For states with a shortfall, we subtracted supply from demand and divided the difference by demand. For the surplus table, we subtracted demand from supply and used the same denominator. Both tables rank unrounded percentages and display one decimal place. States with the same displayed percentage can therefore occupy different ranks. Indiana's 30-FTE surplus is less than 0.1% of demand.
The forecast starts from 2023 and carries forward patterns of workforce entry, exits, hours worked and healthcare use as the population changes. Under those assumptions the projected national RN shortfall is 108,960 FTEs in 2038. HRSA also models how national demand would change with improved access to care. The national scenario comparison gives the assumptions and results for both cases.
Sources
- HRSA, Workforce Projections Dashboard (accessed 2026-11-20). December 2025 release and forecast period.
- HRSA, Workforce Projections workbook (accessed 2026-11-20). Worksheet
Stacked FY2025, Registered Nurses, 2038. Select a state or D.C. and total rurality. Columns L and M give baseline supply and demand in FTEs. - HRSA, Nurse Workforce Projections, 2023–2038 (accessed 2026-11-20). National projections, state RN comparisons and the 40-hour FTE definition.
- HRSA, Nursing Model Components (accessed 2026-11-20). RN model assumptions for entry, attrition, participation and demand.