
Browse nursing market profiles for cities, towns and other U.S. locations. Choose a state to find its cities, towns and other local areas. Each guide identifies the area used for occupation-level wages and employment; where available, local sections show care providers, nursing school awards, and the size of the health workforce.
Find a city by state
Northeast
| Connecticut | Maine | Massachusetts |
| New Hampshire | New Jersey | New York |
| Pennsylvania | Rhode Island | Vermont |
Midwest
| Illinois | Indiana | Iowa |
| Kansas | Michigan | Minnesota |
| Missouri | Nebraska | North Dakota |
| Ohio | South Dakota | Wisconsin |
South
| Alabama | Arkansas | Delaware |
| District of Columbia | Florida | Georgia |
| Kentucky | Louisiana | Maryland |
| Mississippi | North Carolina | Oklahoma |
| South Carolina | Tennessee | Texas |
| Virginia | West Virginia |
West
| Alaska | Arizona | California |
| Colorado | Hawaii | Idaho |
| Montana | Nevada | New Mexico |
| Oregon | Utah | Washington |
| Wyoming |
Major nursing markets
The tables cover the ten largest U.S. cities by population as of July 1, 2025. NurseRecruiter compiled RN pay and employment from the May 2025 BLS employer survey for the named metro areas.
Other city guides
| Jacksonville | Austin | San Jose |
| Charlotte | Columbus | Indianapolis |
| San Francisco | Seattle | Denver |
| Boston |
Northeast and Midwest
| City guide | Metropolitan area | RN employment | Median hourly pay | Median annual pay |
|---|---|---|---|---|
| New York City | New York-Newark-Jersey City, NY-NJ | 197,740 | $57.56 | $119,720 |
| Philadelphia | Philadelphia-Camden-Wilmington, PA-NJ-DE-MD | 73,790 | $48.64 | $101,180 |
| Chicago | Chicago-Naperville-Elgin, IL-IN | 100,240 | $48.31 | $100,490 |
Texas
| City guide | Metropolitan area | RN employment | Median hourly pay | Median annual pay |
|---|---|---|---|---|
| Houston | Houston-Pasadena-The Woodlands, TX | 65,910 | $48.00 | $99,830 |
| San Antonio | San Antonio-New Braunfels, TX | 23,660 | $45.37 | $94,370 |
| Dallas | Dallas-Fort Worth-Arlington, TX | 76,680 | $48.76 | $101,420 |
| Fort Worth | Dallas-Fort Worth-Arlington, TX | 76,680 | $48.76 | $101,420 |
West
| City guide | Metropolitan area | RN employment | Median hourly pay | Median annual pay |
|---|---|---|---|---|
| Los Angeles | Los Angeles-Long Beach-Anaheim, CA | 109,360 | $65.18 | $135,560 |
| San Diego | San Diego-Chula Vista-Carlsbad, CA | 28,680 | $67.08 | $139,520 |
| Phoenix | Phoenix-Mesa-Chandler, AZ | 53,700 | $48.48 | $100,830 |
Dallas and Fort Worth share the Dallas–Fort Worth–Arlington survey area. Both rows refer to the same RN workforce. The Philadelphia metro includes parts of four states. A metro figure describes employers across its full area, even when the guide focuses on one city.
Compare both sides of a state line
| Shared wage market | Local guides |
|---|---|
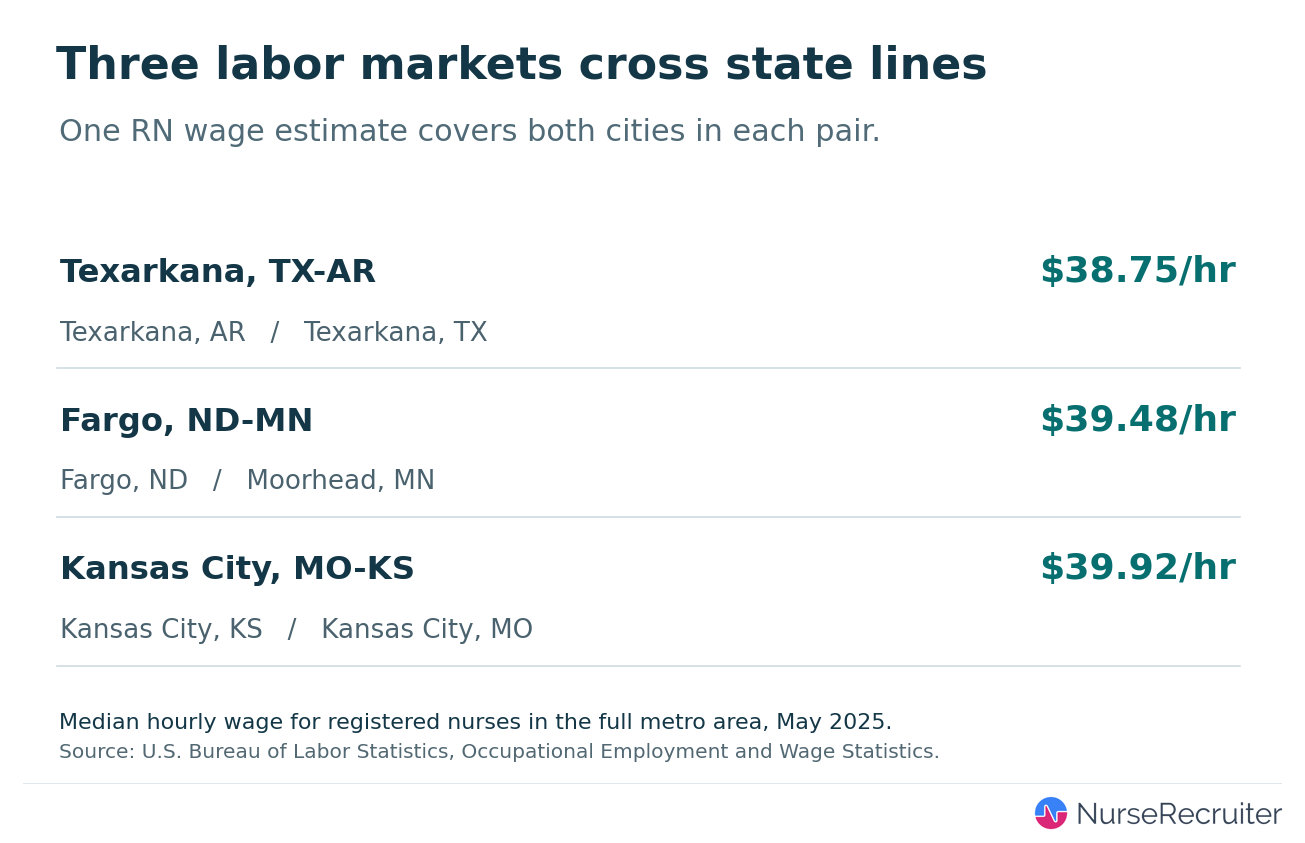
| Texarkana, TX-AR | Texarkana, AR · Texarkana, TX |
| Fargo, ND-MN | Fargo, ND · Moorhead, MN |
| Kansas City, MO-KS | Kansas City, KS · Kansas City, MO |
Each pair shares one federal RN wage estimate. The guides identify facilities by location. Consult the state profile for the jurisdiction where you will practice.
How to use the numbers
- Registered nurse employment and wages come from the Bureau of Labor Statistics survey of employers. The median is the midpoint of straight-time wages. Shift premiums, overtime premiums and benefits are excluded. Compare an RN offer using the hours and premiums in the written agreement.
- City health-sector employment counts covered jobs physically located inside the city boundary, including nonclinical jobs in health care and social assistance. These figures use U.S. Census workplace records. They measure a different workforce than the metro RN estimates.
- Care settings come from Medicare’s provider files. Each city guide identifies which geography and file apply to its facility counts. For statewide employer industries, additional wage markets and workforce projections, open Nursing by State.
Related articles
- Registered nurse pay — Compare the local RN wage distribution with state and national benchmarks.
- Regional price parities — Account for differences in local prices when comparing wages.
- Moving states as a nurse — Trace the licensing steps for a move across state lines.
Sources
- U.S. Census Bureau, 2025 city population estimates, table 5 (accessed 2026-11-13).
- U.S. Bureau of Labor Statistics, May 2025 metro employment and wages (accessed 2026-11-13).
- U.S. Bureau of Labor Statistics, May 2025 OEWS wage definitions and methodology (accessed 2026-11-13).
- U.S. Census Bureau, 2024 workplace employment data (accessed 2026-11-13).
- Centers for Medicare & Medicaid Services, Provider Data Catalog (accessed 2026-11-13).