
NurseRecruiter · 2024 edition
Comparing employees’ annual family-plan premiums with RN pay, state by state.
In 2024, the average annual employee premium for family health insurance equaled 228.6 hours of RN pay in Alabama, the highest state estimate, and 93.7 hours in Oregon, the lowest. The comparison covers all 50 states and D.C.
Fewer hours is the better result on this measure: the premium takes less RN pay. More hours means it takes more pay. Rank 1 is the least affordable end of the comparison; rank 51 is the most affordable. This ranks premium costs relative to pay, not the quality of health plans. The premiums cover private-sector employees across occupations, not nurses specifically; pay is the statewide median RN hourly wage.
Latest edition: Health Insurance in RN Hours
Why the dollar premium is not the rank
California’s 2024 employee premium estimate was $9,148, higher than Alabama’s $7,808. But California’s median RN wage was also much higher: $67.47 an hour, compared with $34.16. Covering the estimated premium therefore took 135.6 hours in California and 228.6 in Alabama.
The ranking compares the premium with pay. It is not a list of the highest premium bills.
Family coverage across the states
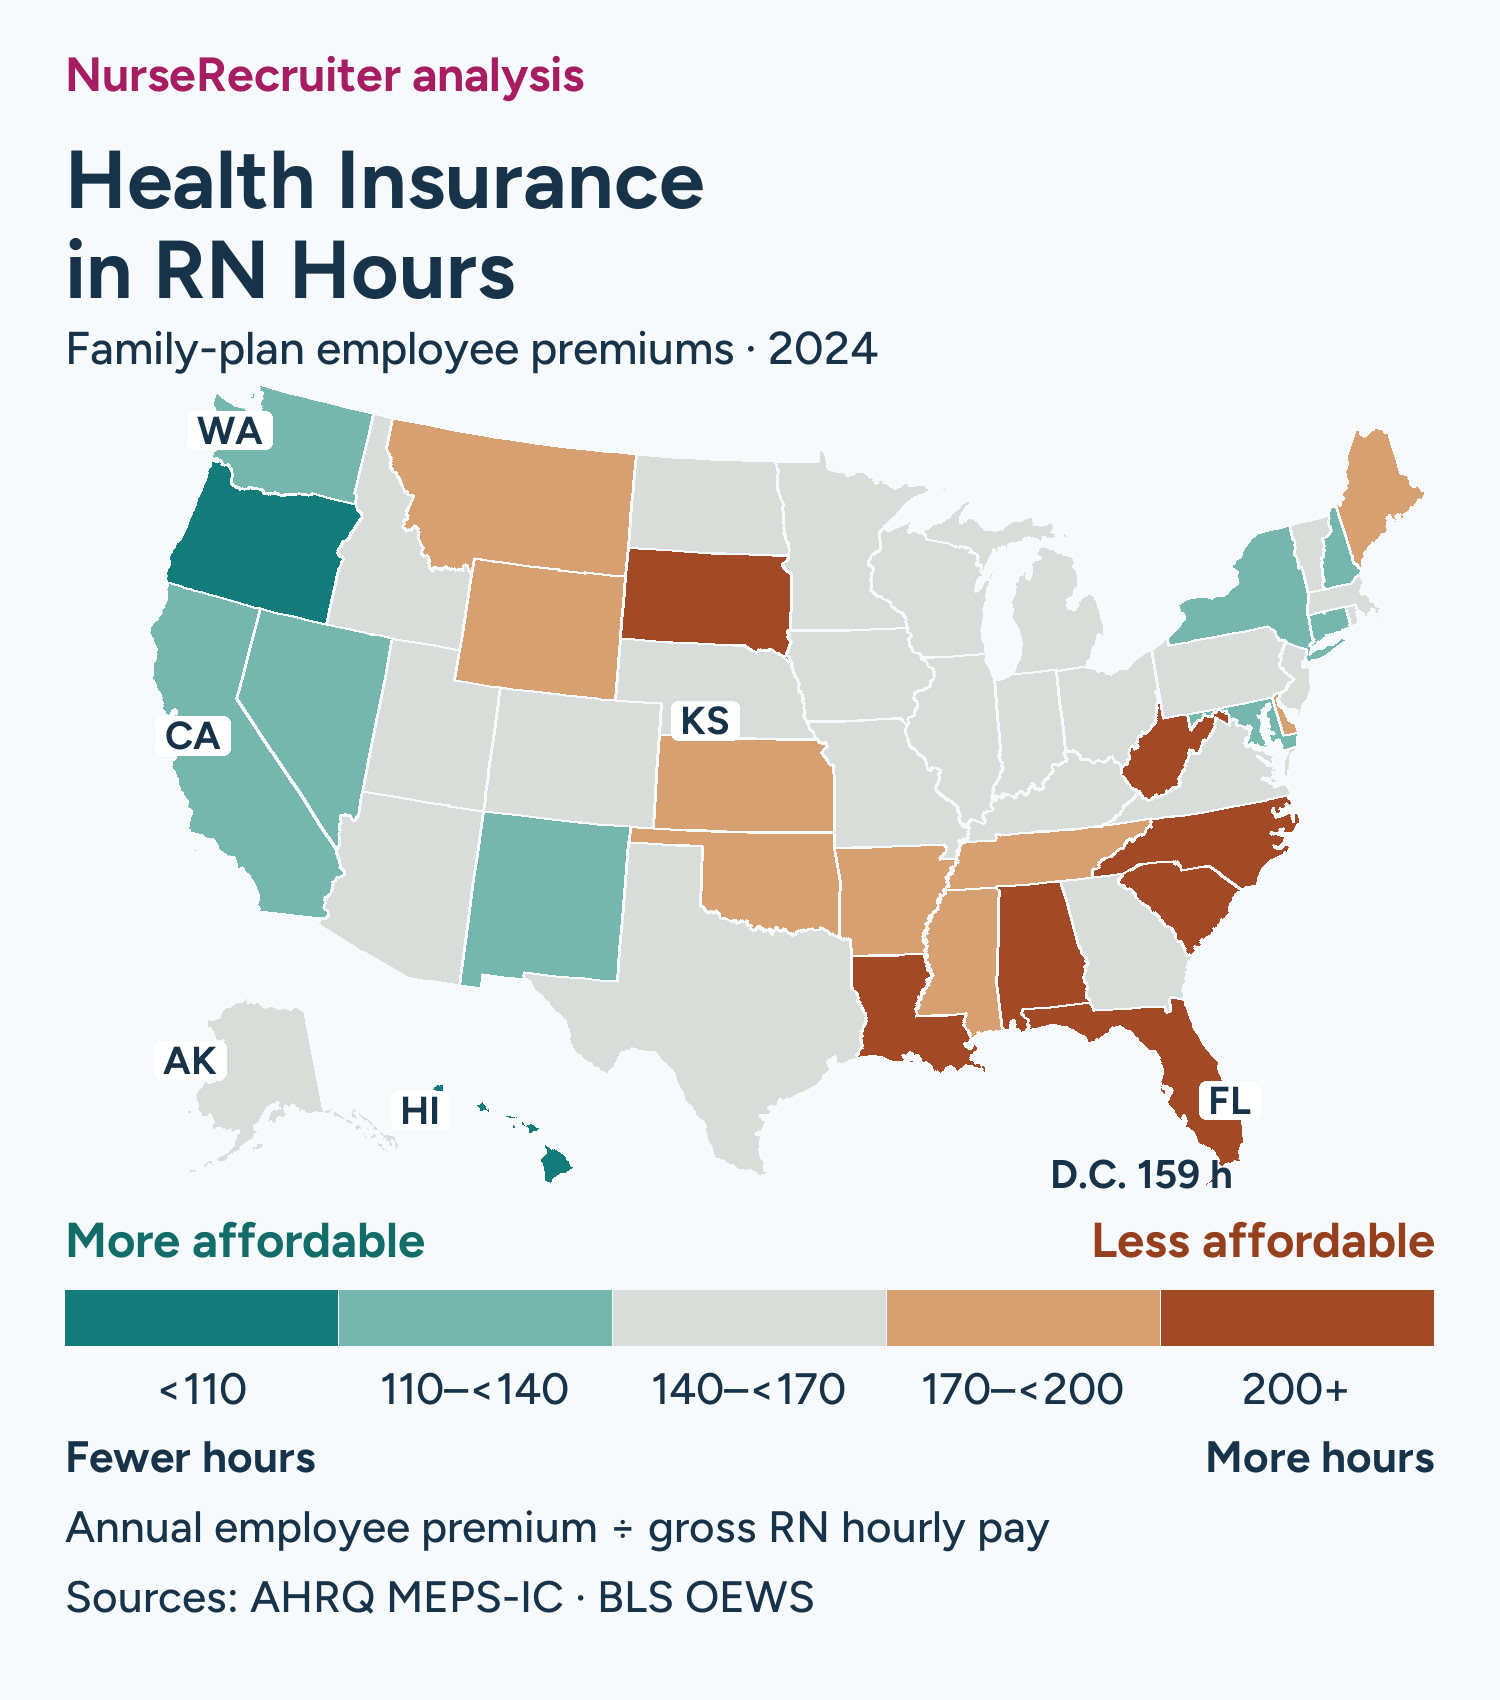
Teal means more affordable premiums relative to RN pay; orange means less affordable. The calculation divides average annual employee contributions for private-sector family plans across occupations by median RN hourly pay across sectors. Sources: 2024 AHRQ MEPS-IC and BLS OEWS; NurseRecruiter analysis. Alaska and Hawaii are inset; D.C. is labeled. Boundaries: U.S. Census, simplified by U.S. Atlas.
State rankings, 2024
The table runs from least affordable to most affordable relative to RN pay. Fewer hours is the better result on this measure.
| Rank | State | Employee contribution / year | RN pay / hour | Gross wage hours |
|---|---|---|---|---|
| 1 | Alabama | $7,808 | $34.16 | 228.6 |
| 2 | Louisiana | $8,600 | $37.92 | 226.8 |
| 3 | Florida | $8,831 | $39.83 | 221.7 |
| 4 | West Virginia | $8,290 | $38.46 | 215.5 |
| 5 | South Dakota | $7,077 | $33.42 | 211.8 |
| 6 | South Carolina | $7,832 | $38.41 | 203.9 |
| 7 | North Carolina | $7,968 | $39.36 | 202.4 |
| 8 | Kansas | $7,207 | $37.53 | 192.0 |
| 9 | Tennessee | $7,247 | $38.00 | 190.7 |
| 10 | Montana | $7,390 | $39.21 | 188.5 |
| 11 | Mississippi | $6,692 | $35.80 | 186.9 |
| 12 | Oklahoma | $7,085 | $39.02 | 181.6 |
| 13 | Maine | $6,955 | $39.84 | 174.6 |
| 14 | Arkansas | $6,456 | $37.08 | 174.1 |
| 15 | Delaware | $7,726 | $44.53 | 173.5 |
| 16 | Wyoming | $6,818 | $39.32 | 173.4 |
| 17 | Iowa | $6,230 | $37.00 | 168.4 |
| 18 | Wisconsin | $6,886 | $41.38 | 166.4 |
| 19 | Kentucky | $6,389 | $38.42 | 166.3 |
| 20 | Nebraska | $6,475 | $38.95 | 166.2 |
| 21 | Illinois | $6,888 | $41.54 | 165.8 |
| 22 | Indiana | $6,422 | $38.82 | 165.4 |
| 23 | Vermont | $6,577 | $40.94 | 160.6 |
| 24 | Colorado | $7,441 | $46.40 | 160.4 |
| 25 | Virginia | $6,847 | $42.70 | 160.4 |
| 26 | Michigan | $6,577 | $41.19 | 159.7 |
| 27 | Idaho | $6,600 | $41.39 | 159.5 |
| 28 | Massachusetts | $7,811 | $49.03 | 159.3 |
| 29 | Missouri | $6,109 | $38.35 | 159.3 |
| 30 | District of Columbia | $7,987 | $50.27 | 158.9 |
| 31 | Texas | $6,851 | $43.27 | 158.3 |
| 32 | Alaska | $8,409 | $53.22 | 158.0 |
| 33 | Pennsylvania | $6,633 | $42.12 | 157.5 |
| 34 | Georgia | $6,453 | $41.61 | 155.1 |
| 35 | North Dakota | $5,695 | $37.62 | 151.4 |
| 36 | Utah | $5,862 | $39.55 | 148.2 |
| 37 | New Jersey | $7,305 | $49.39 | 147.9 |
| 38 | Ohio | $5,695 | $39.06 | 145.8 |
| 39 | Arizona | $6,746 | $46.58 | 144.8 |
| 40 | Minnesota | $7,010 | $48.50 | 144.5 |
| 41 | Rhode Island | $6,821 | $48.06 | 141.9 |
| 42 | Connecticut | $6,747 | $48.84 | 138.1 |
| 43 | Maryland | $6,364 | $46.55 | 136.7 |
| 44 | Washington | $7,365 | $53.93 | 136.6 |
| 45 | New Mexico | $5,786 | $42.43 | 136.4 |
| 46 | California | $9,148 | $67.47 | 135.6 |
| 47 | New Hampshire | $6,220 | $46.55 | 133.6 |
| 48 | New York | $6,278 | $50.77 | 123.7 |
| 49 | Nevada | $5,690 | $49.03 | 116.1 |
| 50 | Hawaii | $6,484 | $65.54 | 98.9 |
| 51 | Oregon | $5,584 | $59.61 | 93.7 |
Method
NurseRecruiter divided each state’s average annual employee contribution for family coverage by its median RN hourly wage. Both inputs refer to 2024. Premiums come from AHRQ MEPS-IC Table II.D.2, all private-sector employer sizes; wages come from BLS OEWS for registered nurses, occupation 29-1141, across industries and ownerships.
All 51 jurisdictions have published values for both inputs. This edition preserves the 2024 comparison; the latest article separately reports changes from this baseline.
The result is a comparison of gross pay before taxes. It excludes the employer’s premium contribution, deductibles and other out-of-pocket care costs. State averages do not establish the premium or plan quality in a particular nursing job.
Ranks use exact ratios before display rounding. Both inputs are survey estimates; small rank differences are not evidence of statistically distinct costs. AHRQ’s contribution standard errors do not measure uncertainty in the full premium-to-wage ratio.
Citing this study
Credit the rankings to NurseRecruiter’s Health Insurance in RN Hours, 2024 edition, and link to this dated article. Underlying data: AHRQ 2024 MEPS-IC employee contributions for private-sector family coverage and BLS May 2024 median RN hourly wages.
Related topics
- Health Insurance in RN Hours — latest edition
- Comparing Nursing Benefits Packages
- Nursing pay and cost-of-living datasets
Sources
-
AHRQ, 2024 employee contributions for family coverage and standard errors, Table II.D.2, pages 163–164 (accessed 2026-11-20).
-
BLS, May 2024 state occupational wage estimates (accessed 2026-11-20). Registered nurses, occupation 29-1141, median hourly wage.
-
AHRQ, MEPS-IC precision guidelines (accessed 2026-11-20).
-
U.S. Atlas, Census-derived state boundaries (accessed 2026-11-20).