
The U.S. Bureau of Labor Statistics reported 4,850 registered nurse jobs in the Reno, Nevada wage reporting area in May 2025. Median pay was $51.69 an hour ($107,520 a year). These figures cover the reporting area, not Fernley alone.
Nevada is not a member of the Nurse Licensure Compact. A multistate license from another state does not by itself authorize practice there. Registered nurses are licensed by the Nevada State Board of Nursing.
Employment and pay by nursing occupation
One regional workplace is South Lyon Medical Center in Yerington (Lyon County). Other local guides include Fallon and Sparks.
The Census Bureau estimated 26,214 residents in Fernley city on July 1, 2025 (Vintage 2025). This population estimate covers the locality, not the wider wage reporting area.
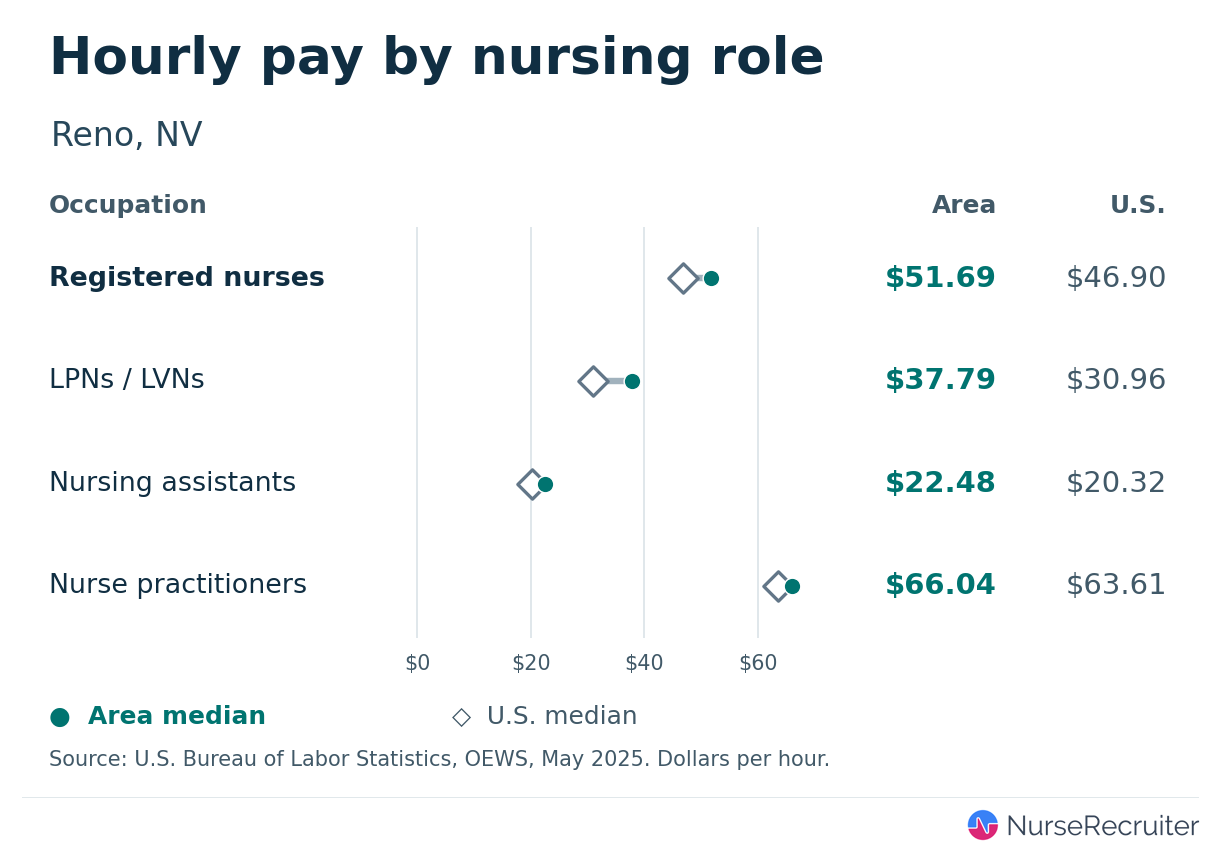
May 2025 employer estimates for Reno, NV. The 25th and 75th percentiles mark the middle half of hourly wages within each occupation.
| Nursing occupation | Employment | Hourly 25th percentile | Hourly median | Hourly 75th percentile | Annual median |
|---|---|---|---|---|---|
| Registered nurses | 4,850 | $40.53 | $51.69 | $52.52 | $107,520 |
| LPNs and LVNs | 510 | $32.35 | $37.79 | $39.27 | $78,600 |
| Nursing assistants | 1,430 | $18.99 | $22.48 | $23.02 | $46,760 |
| Nurse practitioners | 420 | $52.92 | $66.04 | $73.76 | $137,360 |
| Nurse anesthetists | — | — | — | — | — |
| Nurse midwives | — | — | — | — | — |
The RN median was 10.2% above the U.S. median of $46.90 an hour. The RN location quotient was 0.81. A value of 1.00 means RNs account for the same share of local payroll jobs as they do nationally. BLS reports straight-time wages across employers. Overtime, shift differentials and employer benefit costs are excluded. A dash means BLS did not publish a usable numeric estimate for that cell.
The Reno, NV metro placed 56th of 380 in the 2024 RN purchasing-power ranking. The region’s $49.82 median equaled $49.32 an hour at national average prices in NurseRecruiter’s RN Purchasing Power study. A verified 2023 comparison is unavailable for this metro. BLS May 2024 wages and BEA 2024 prices cover the metro, not the city alone; pay is before taxes.
Local nursing workplaces
The provider and health-center files did not yield a site that could be assigned confidently to Fernley. The example below is elsewhere in Lyon County, at its own reporting address.
| Workplace | Documented nursing setting |
|---|---|
| South Lyon Medical Center (Yerington) | CMS lists this critical access hospital with a mailing address in Yerington. See critical access hospitals. |
Health care employment
In 2024, Census workplace records counted 238 health care and social assistance jobs out of 4,872 covered jobs in Fernley (4.9%). The industry count includes clinical and nonclinical jobs located there. A person holding two covered jobs can contribute to both.
Health industry employment in Lyon County
BLS annual payroll records cover these private employers throughout Lyon County. Jobs include nurses, other clinicians, and administrative and support staff. Government payrolls are excluded.
| Private-sector industry | Establishments | Average payroll jobs in 2025 | Change from 2024 |
|---|---|---|---|
| Ambulatory health care services | 36 | 276 | +17 |
Nearby nursing markets
| Local guide | Wage reporting area | RN hourly median, May 2025 |
|---|---|---|
| Fernley | Reno, NV | $51.69 |
| Fallon | Balance of Nevada nonmetropolitan area | $48.18 |
| Sparks | Reno, NV | $51.69 |
| Census place | Health care and social assistance workplace jobs, 2024 | Share of covered jobs |
|---|---|---|
| Fernley | 238 | 4.9% |
| Fallon | 855 | 19.3% |
| Sparks | 4,937 | 9.9% |
The Census counts covered jobs at the workplace across all occupations in this industry.
For a statewide comparison, see regional RN pay in Nevada.
Related topics
- Nursing in Nevada
- Nursing in Fallon, Nevada — Compare local health care employment across the nearby markets.
- Critical Access Hospitals — Background for the South Lyon Medical Center (Yerington) entry in the workplace table.
- How to Compare RN Pay Offers — How to compare the pay and scheduled hours in two RN offers.
Sources
-
NCSBN, Nurse Licensure Compact implementation status map and table (accessed 2026-11-18).
-
Nevada State Board of Nursing (accessed 2026-11-18).
-
BLS, May 2025 metropolitan and nonmetropolitan occupational employment and wage estimates (accessed 2026-11-13).
-
U.S. Census Bureau, LEHD Origin-Destination Employment Statistics, workplace series (accessed 2026-11-13).
-
BLS, 2025 QCEW annual data for Lyon County (CSV) (accessed 2026-11-13).
-
BLS, May 2025 survey definitions and pay coverage (accessed 2026-11-13).
-
CMS, Hospital General Information (2026-10-26) (accessed 2026-11-13).
-
U.S. Census Bureau, 2025 Gazetteer geographic reference points (accessed 2026-11-13).
-
U.S. Census Bureau, Vintage 2025 whole-place population estimates (accessed 2026-11-19).
-
NurseRecruiter, RN Purchasing Power, 2024 results (accessed 2026-11-20): BLS median RN wages and BEA regional prices; annual changes use comparable 2023–2024 observations.